The Most Important Equalization Step
by Pat Brown
Pat presents the most important step in the equalization process. It includes his technique and some war stories.
It’s time to “tune” the system. You book the time slot, and show up on site with your favorite dual-channel FFT measurement system. The mic goes up and you make a measurement that reveals a magnitude vs. frequency plot of that measurement position. Equalizer filters are applied in an attempt to smooth the response. Unfortunately, when you move the mic to other measurement positions, you find that each has a unique frequency response. The settings of the equalizer depend completely on the mic positions that you happen to pick. The reason for this is simple.
The impulse response of a loudspeaker in an enclosed space is unique at every point in the space. This inescapable fact makes the frequency response magnitude unique at every point in the space. There is no magic curve that is right for every seat. This isn’t new information, but it needs to be repeated for each new generation of audio practitioners.
That’s not to say that we can’t do useful things with equalizers. But let’s make sure our efforts are meaningful. The equalization of a sound system is a process with several steps. The steps are progressive and must be done in order. This blog deals only with the first, but most important step.
The only sound field that is independent of the room is the direct field. Knowing the direct field response is invaluable for assessing what to attempt to equalize and what to ignore. Fortunately, all you need to measure the direct field is a large space.
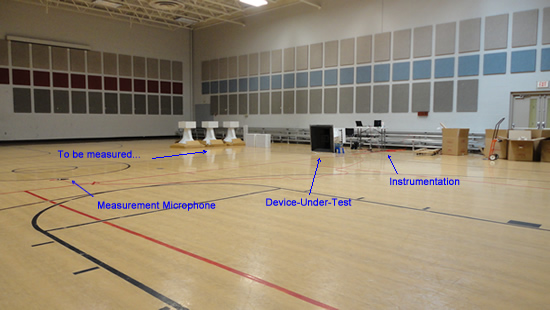
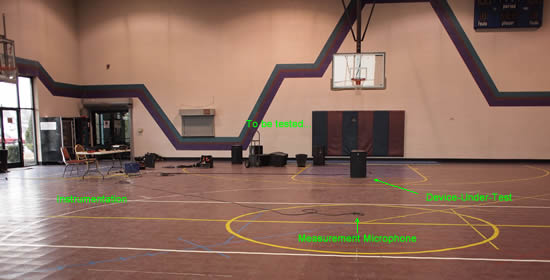
Image 1 – The gymnasium of this facility provided a perfect space for the direct field measurements.
Equalization – Step 1
Step 1 is the measurement of the axial anechoic direct field response of the loudspeaker. Why? Here are some reasons.
1. It provides the information needed for corrective equalization.
2. It can rarely be acquired “in situ.” Once the loudspeaker is mounted, very early reflections alter the response. These cannot be removed by a time window due to their close time relationship to the direct arrival.
3. The axial response provides an important reference that I can recall later for comparison with “in situ” measurements.
4. This measurement can be compared with the published sensitivity plot from the manufacturer. Significant differences may indicate a problem with the device.
5. This first equalization step is “on site quality control.” It allows you to make sure everything is working properly before flying the loudspeaker. It is MUCH more difficult to swap a high frequency driver or tighten a loose grill when the loudspeaker is hanging 30 feet off the deck.
If the bumps and dips in the response are inherent to the loudspeaker, they may respond to corrective equalization. If they are due to early reflections, then they will be different at each measurement position.
The direct field measurement can be done on site, just not in situ. I like to find a large space at the facility that I can borrow for a few hours. Gymnasiums are perfect. I place the loudspeaker on the floor, and the microphone in its far-field (3-10 times the largest dimension of the loudspeaker away). The impulse response is measured and a time window is used to remove the first reflection (and therefore all later reflections).
If the project has multiple loudspeakers, the process is repeated for each. Like models should have similar responses.
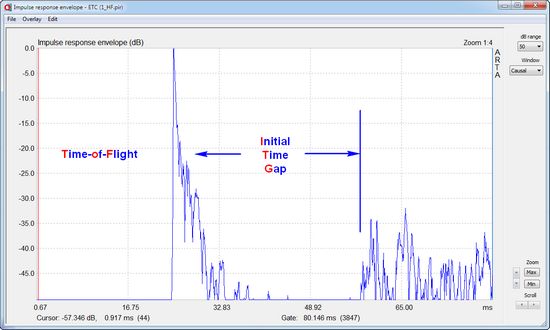
Figure 1 – The ground plane measurement setup produces a long time span before the arrival of the first room reflection. Reflected sound can be easily windowed out while retaining good frequency resolution of the direct field.
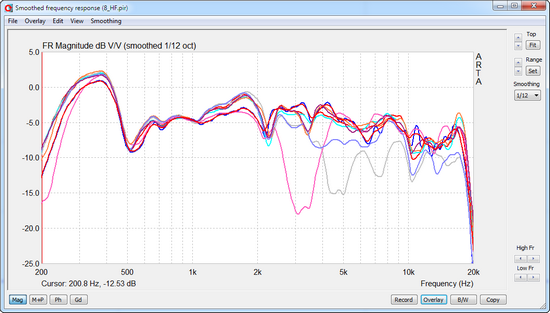
Figure 2 – The overlaid frequency response magnitudes of 8 “same make/model” loudspeakers. Measuring them in advance allowed the problems to be more easily corrected.
Why On-Axis?
There are several reasons.
1. The loudspeaker’s sensitivity is always measured on-axis. If the manufacturer provides a measured response, it is for this position.
2. Someone will be sitting there. It is good sound system design practice to aim the loudspeaker into a seating area.
3. Well-controlled loudspeakers will have similar on and off-axis response within their rated coverage angles. If the off-axis response is dramatically different than the on-axis response, then there is not much you can do with equalization, at least as a “corrective” process.
4. If the on and off-axis response are similar, then filters that improve the on-axis response will improve the off-axis response.
Measurement Mic Placement
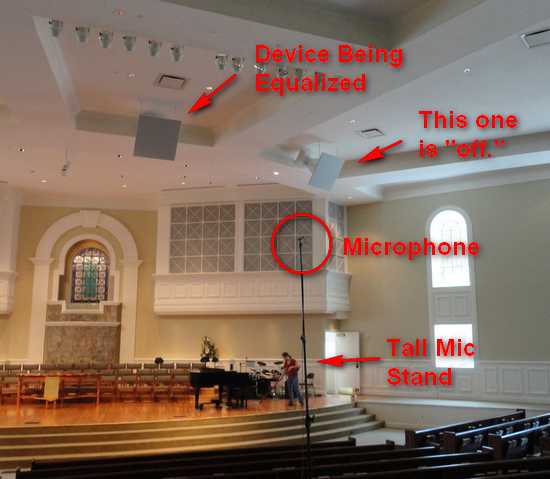
Once the loudspeaker is placed in the room, the axial response can be re-measured and compared to the anechoic response. The measurement microphone must be placed so that reflections from nearby surfaces (floor or seats) arrive late enough in time to be windowed out. A tall mic stand is useful to this end.
Image 2 – The microphone is placed on-axis and in the far-field of the DUT. A time window removes room reflections. Any difference between this measurement and the reference measurement is due to early reflections from surfaces near the DUT that are still inside of the time window.
Some War Stories
Eight “identical” loudspeakers were to be implemented in a zoned distributed system (Image 3). Each would cover a unique audience area. “Step 1” as described above revealed that three of the loudspeakers were dramatically different than the other five (Figure 2). Further investigation revealed that they were from different manufacturing runs and had different HF drivers and crossovers than the others. In addition, of the eight devices tested, two had accidental polarity reversals on one of the transducers. This information allowed us to easily correct the polarity issues, and determine that the “odd” devices needed a different DSP channel than the others.
Image 3 – “On-site quality control’ in the gymnasium.
Another project had four large format mid/high horns as the main loudspeakers in the auditorium. We measured them in the gym before mounting them in the auditorium. The response appeared a bit “choppier” than the published sensitivity plots – not a major concern, but worth a closer look. Further investigation revealed that the foam used to reduce the edge diffraction of the HF horn had come off in shipping and was still in the boxes. After gluing it back on the responses looked as expected.
Part of our Sydney, Australia class was a “class project” tuning of the new sound system in the lecture hall. The loudspeakers were already mounted, and included left-center-right mains and a distributed system for the rear of the auditorium. The left and right loudspeakers had dramatically different low frequency responses than the center channel. The left and right were mounted in close proximity to a very large HVAC duct, and we theorized that a strong early reflection was causing a boundary loading condition, with the expected “boundary dip” and low frequency rise. If we had a direct field measurement as a reference (we didn’t) we could know immediately whether the response anomaly was inherent to the loudspeaker or due to the placement.
In Conclusion
Performing an anechoic direct field measurement is an important first step to the equalization process. It reveals the best possible response for the device being equalized. Good system design practice is to try to preserve this response when placing/mounting the loudspeaker in the auditorium. When the anechoic response is known, the cause of changes to the frequency response can only be due to the proximity of the loudspeaker to room surfaces. Unfortunately, such anomalies cannot be corrected by equalization.
“Limit what you observe, to what you can correct.” pb

