Audience Effects on Sound Wave Propagation
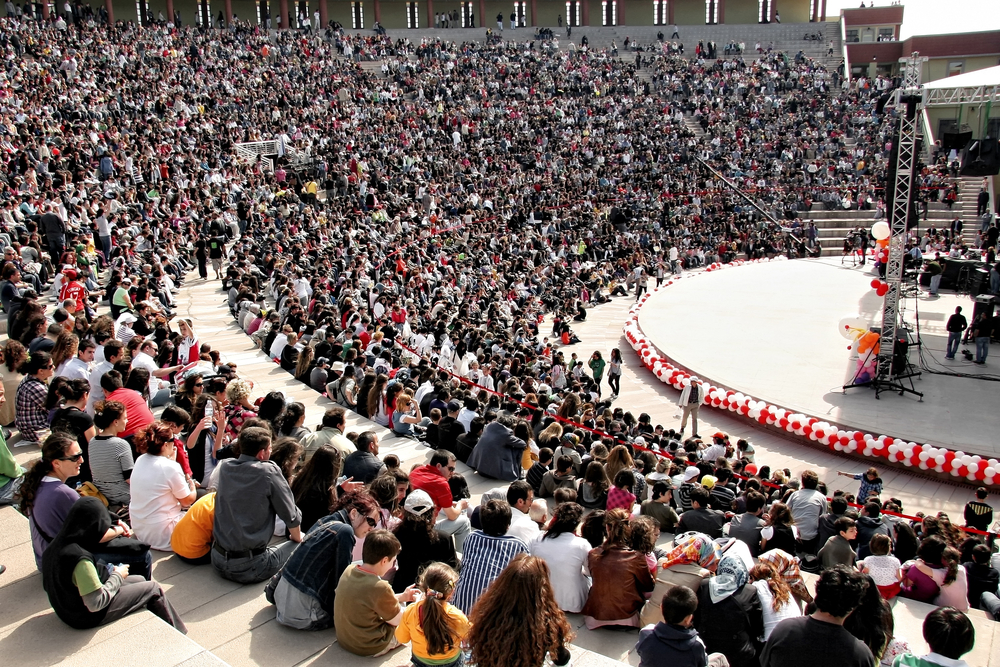 by Fedele De Marco
Effects of the audience on the propagation of low frequencies of subwoofers arrays in live concerts.
“When people arrive… it all changes”
Abstract
In a live concert, the propagation of low frequencies generated by a sound reinforcement system is different depending on the presence or absence of the public and is closely related to its quantity and density.
This article reports a campaign of measures that illustrates a specific aspect, among the various possible effects of an audience. In particular, a “slowing down” of low frequency wave fronts is highlighted as the number of people and their density/distribution increase.
Although the measurement methods used cannot exclude other contributions to the phenomenon, the afore mentioned general trend clearly emerges. A personal hypothesis is then contextually advanced that can explain this behavior.
It is obvious to emphasize that further research and in-depth studies are necessary. It is necessary to set up a new campaign of direct measurements of the speed of sound through the public and above all it is important to define all the variables involved and produce a mathematical model capable of codifying the phenomenon.
Introduction
Arrays of subwoofers are commonly used for the low frequency reinforcement of the musical program in live concerts, as an extension of the main audio system. Often these arrays of subwoofers are placed on the ground, in front of the stage or on the sides of the same. Operating in very often different places, with often variable architectural and atmospheric conditions, each large audio system must be well designed beforehand and optimized on location. The optimization of sound reinforcement systems consists first of all in ear verification and common analysis softwares (Systune™, Smaart™, RITA™, REW™, etc.) (1).
The effects of the audience on the hall acoustics have been well known for a longtime. There are numerous research projects carried out in this sense (2), just as the effects of temperature and humidity on the propagation of sound at high frequencies are well known. There are also some studies on the effects of the distribution and density of the audience on the variation in terms of SPL of the energy coming from the subwoofers (3).
However, it has not been possible to trace studies, research, and writings on the concrete effects of the presence of the public on the afore mentioned temporal variation of the low frequencies.
The present research therefore aims to illustrate, with non-direct measurements of the speed of sound, the effects of a real audience layer on the propagation speed of sound generated by an array of subwoofers. In particular, a slowdown in the speed of low frequency sound that passes through the audience it would be deduced.
It is therefore contextually proposed the hypothesis that the audience slows down the wavefronts generated by the subwoofers, as its behavior is similar to that of a layer of porous material. Measurements are therefore made, during real live performances, in contexts ranging from a few hundred to a few thousand people. Various types of configurations are also tested to verify the variation of these effects as the distribution of subwoofers varies.
In this work I was supported by Emiliano Di Marco. His measurements will be presented as an integrative part in a future update.
Concepts
For greater clarity, it is necessary to define synthetically some concepts that are mentioned in this work and that can help in its best understanding. In this first research, indirect measurements of wavefront slowdown are carried out with FFT analyzers, commonly used in the tuning operations of sound reinforcement systems.
Measurements of both transfer function (TF) and impulse response (IR) are carried out. In particular, the slowdown is highlighted by reading the trace of the phase and the time shift of the impulse responses. An in-depth analysis of the concepts of the aforementioned measures, phase trace and impulse response, is beyond this document.
It is sufficient to know that, although the trace of the phase is a look at the frequency domain and that it is “time blind”, we can anyway obtain temporal information from it.

Figure 1 – Smaart phase trace. The phase trace is “Time Blind.”
We find this temporal information in the slope of the trace. We tend to find that: increased slope = increased delay. In the measured traces, we find the general trend of a phase shift increasing (and therefore of a greater slope) with the number of people and their density.
It should be emphasized that, on the phase shift found, various other factors may have had an influence that are not quantified in this preliminary research.
Porous material
It is not the purpose of this work to describe in detail the acoustic characteristics of porous materials. There is a large bibliography on the subject, easily found on internet and to which reference should be made (4). What interests us here is that in a porous material the speed of sound is directly related to its structure.
In the air the speed of sound is fundamentally linked to temperature and humidity. In a porous material it is inversely proportional to the density of the layer. Assuming the simple case of longitudinal waves, the propagation velocity depends only on the mechanical characteristics of the medium, so if is the modulus of elasticity (Young modulus), ν is the Poisson modulus and ρ is the density, we have:

in units of m/s.
It is also interesting to recall the concept of tortuosity, characteristic of porous materials that is part of the phenomena described here. By tortuosity we mean the path of the wave fronts that cross the public and are forced to make their way between the bodies.
You can find an analytical description of the concept in these documents (5-6). It generally concerns the “flow”, but it can be extended in acoustics to sound wave fronts, due to the increased distances of the winding paths.
In the paper cited in the previous point there is also a simulator with which to directly experiment the concept of tortuosity of the air flow paths through the porous medium, depending on its density.
Effects of the Audience
One can imagine that the public, seen on a large scale, is like a large new solid volume introduced into the room – a sort of large sound-absorbing panel of porous material whose structure increases in density as the number of spectators increase.
Obviously, the propagation of the sound produced by the array of subwoofers towards the front of house when the room is empty, therefore without obstacles, happens according to the shortest path.
The following image shows the Arena Cava Del Sole in Matera (Italy), that is a quarry dug out of the tuff, with a total area of 80 x 60 meters. It hosted the two events in which the measures of this work were carried out:
– Event of 18 July 2019, with about 2000 people seated;
– Event of 19 July 2019, with about 4/5000 people, standing.
The direct path of the wave fronts generated by an array of a line of subwoofers (near the stage to the right of the image) is illustrated, in the direction of the Front-of-House (FOH) structure located at about 38 m from the stage

Figure 2 – The venue that hosted the following research: Arena Cava del Sole, Matera (Italy). Direct sound in empty room.
With the presence of the public the situation changes. Part of the wave fronts, on their way to the FOH, spreading over the heads of the spectators will travel greater distances. Part of these fronts also bypass the public from the side.
Greater surface area = Greater distance = Greater delay
We therefore witness, for this component, a delayed arrival at the FOH position.
In this case, it is not the speed of sound that is changed, given that the transmission takes place mainly in the air, but the distance traveled. This will be demonstrated in the next section “Measures”

Figure 3 – The two main components of wavefront propagation as generated by the subwoofer system.
A second main component of the wavefronts generated by the subwoofers, instead, crosses the audience layer itself. Here the phenomena listed in the previous paragraph take place: the speed of sound variation for greater density and for greater tortuosity of the porous material.
The phenomena of tortuosity of the wave fronts vary with the density of the public (number of people and their density); with a seated audience the tortuosity will generally be less than in a standing audience with greater density.
In this context, part of the sound energy is also absorbed and accumulated by the audience.
But we also said that, within a porous layer, the speed of sound slows down due to the increasing density of the medium. A greater number of people increase this effect. In fact, in the concert with standing audience, where in the space between FOH and the quarry stage more than 4,000 people were concentrated, there was the greatest increase in terms of phase shift.
Measurements
As said measurements were taken of the aforementioned components of low frequency wave fronts in real live concert situations. Two different types of events were chosen, one with a seated audience (18 July 2019), and one with a standing audience (19 July 2019). In both cases the resident sound system was measured which, for low frequency, consisted of a line of subwoofers, arranged as a gradient line, electronically arched.

Figure 4 – The electronically arched gradient cardioid subwoofer array
Making measurements in real situations is difficult, given the possibility of annoying the public and the artists’ productions. Measuring the Main, even if with a filtered signal, would have caused annoyance and discomfort, especially considering that the halls are often filled just before the start of the show. Only the subwoofers were then measured. In fact, the behavior of the upper component of their wave fronts is hypothetically extendable also to the low frequency component of the main.
We have chosen to use the same analyzers commonly used for system tuning (SMAART V7 and V8).
TF and IR measurements were performed. The test signals for the two measurements were pink noise and pink (log) sweep respectively.
Two matched measuring microphones were used; Mellab MY3c. The microphones have been fixed to the Layher structure of the FOH: one above the heads of the spectators, and one very close to the floor.
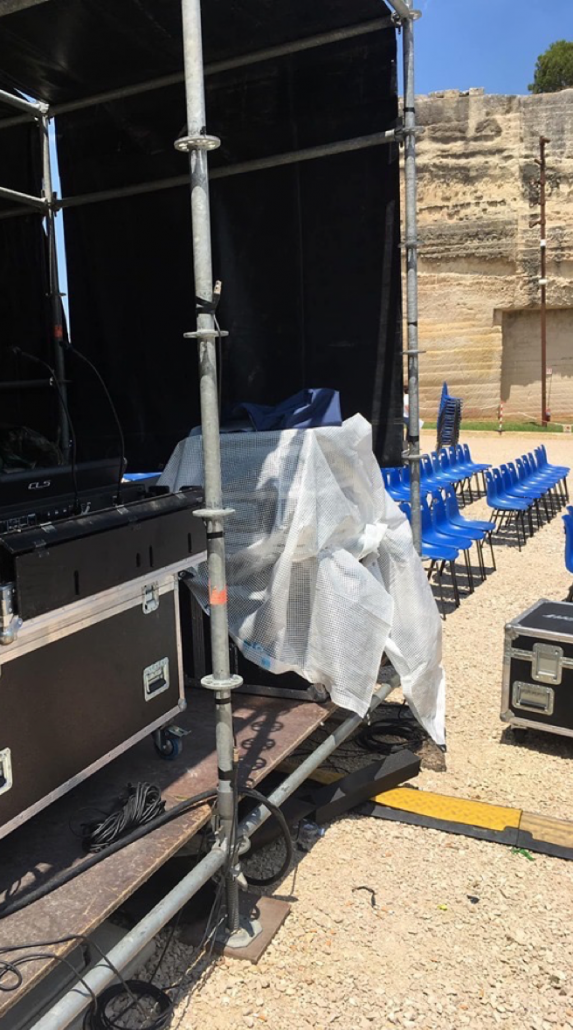
Figure 5 – Visualization of the upper and lower microphone position

Figure 6 – Detail of the lower microphone
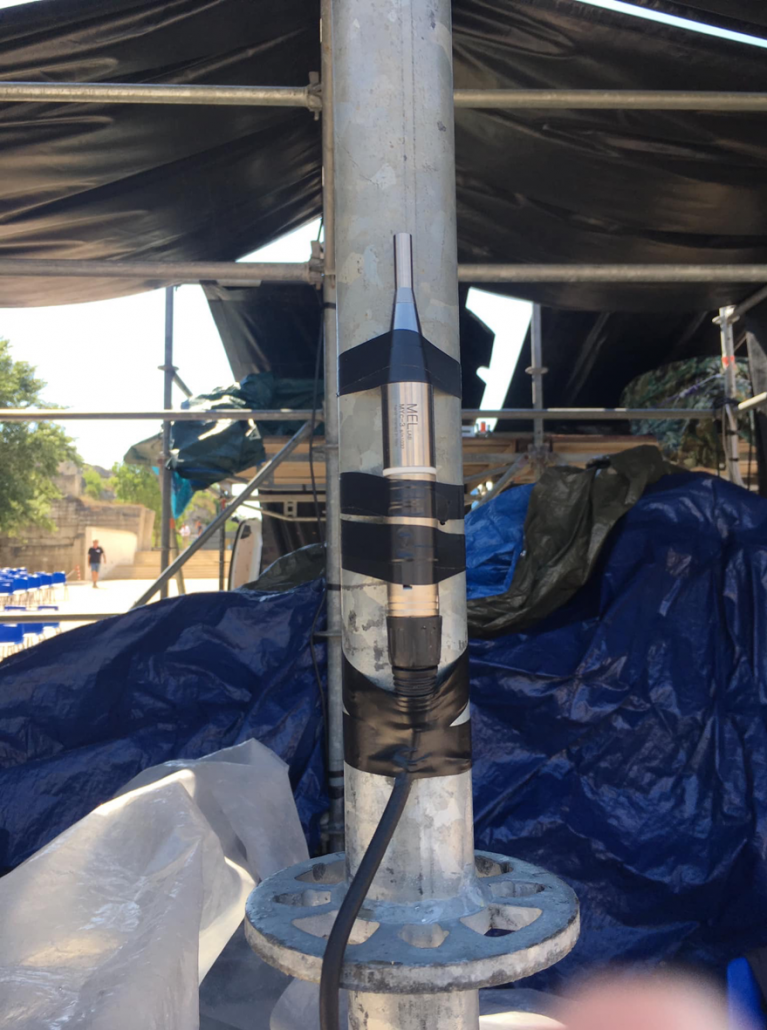
Figure 7 – Detail of the upper microphone
Various measures were taken each evening, starting from empty room conditions and up to the beginning of the shows. Here we will illustrate the results of only three measures: one for the empty room, one close to the beginning of the shows (full hall), and one relating to an intermediate situation.
Since all these are relative measurements, the effects of the positioning of the microphones or of the Layher FOH, etc. have been equally distributed between the measurements themselves, not representing a factor capable of compromising the final result.
What matters is to measure, in each position, the response of the subwoofer array system taking the empty room response as a reference and comparing the subsequent measurements with it (progressive audience increasing).
The analyzer was synchronized only in the measure with empty room. This situation represents the “time zero” reference.
The coherence always remained high. All measurements were performed with an adequate signal-to-noise ratio, obviously within the limits of acceptability allowed by the situation and the public. There were therefore no significant external influences on the measurement.
On the evening of 18 July, around 2,000 people were present, seated and distributed evenly throughout the venue (Figure 11).
On the evening of July 19th, a number ranging from 4,000 to 5,000 progressively thickened.
The results of the two microphone positions in the three different moments for each of the two evenings are illustrated below. In the measurements, temperature and humidity conditions were noted (when possible).

Figure 8 – View of the room from the position of the lower microphone

Figure 9 – View of the room from the upper microphone position

Figure 10 – Overview of the quarry and seating distribution
Upper microphone position – Transfer Function:
First, the the measurement for the empty room:

Figure 11 TF 17:04 pm, Empty Room. Upper microphone

Figure 12 – 17:04 hours
The second measure was carried out with about 200 people present in the room, mainly sitting. There is already an evident increase in the slope of the phase trace.

Figure 13 – TF, 19:55 hours, Temperature 24 ° C, Humidity 46%. Upper microphone
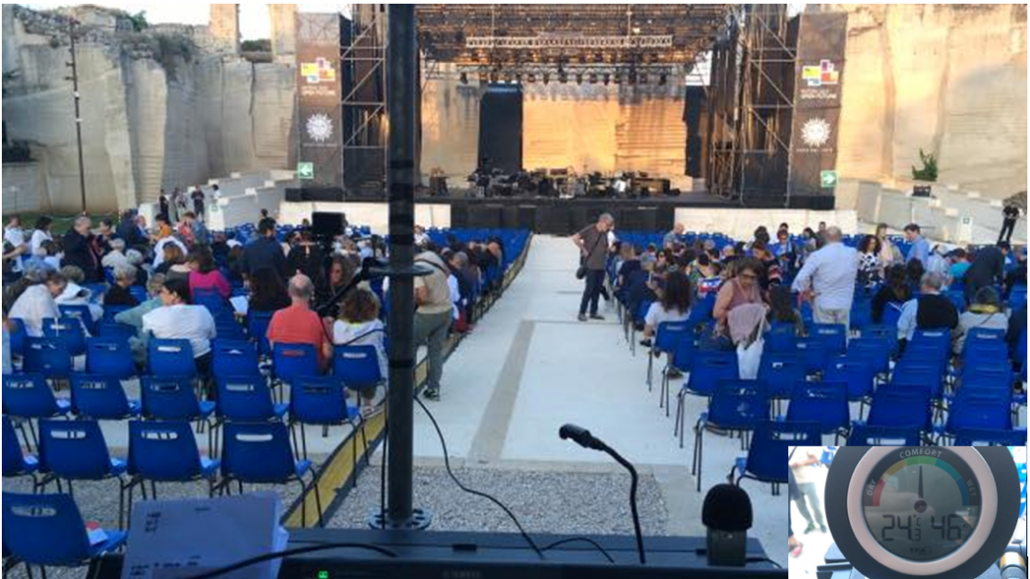
Figure 14 – 19:55 hours, audience
Below is a screenshot of the room being filled. The situation is that of an audience both standing and sitting, static and mobile, placed randomly along the central corridor or in front of the subwoofers and/or in front of the FOH, in a dynamic manner.

Figure 15 – TF, Almost full room, 20:22 hours, T 23 ° C, Humidity 50%. Upper Microphone

Figure 16 – 20:22 hours
Below is the measurement relating to the full hall, close to the beginning of the show. Here the situation is that of an audience for the most part accommodated and static. The central corridor is now practically free.

Figure 17 – TF, 20:45 hours, T 23 ° C, Humidity 45%. Upper microphone

Figure 18 – 20:45 hours, audience
To appreciate the progressive, significant phase shift, let’s now compare all the previous measures:
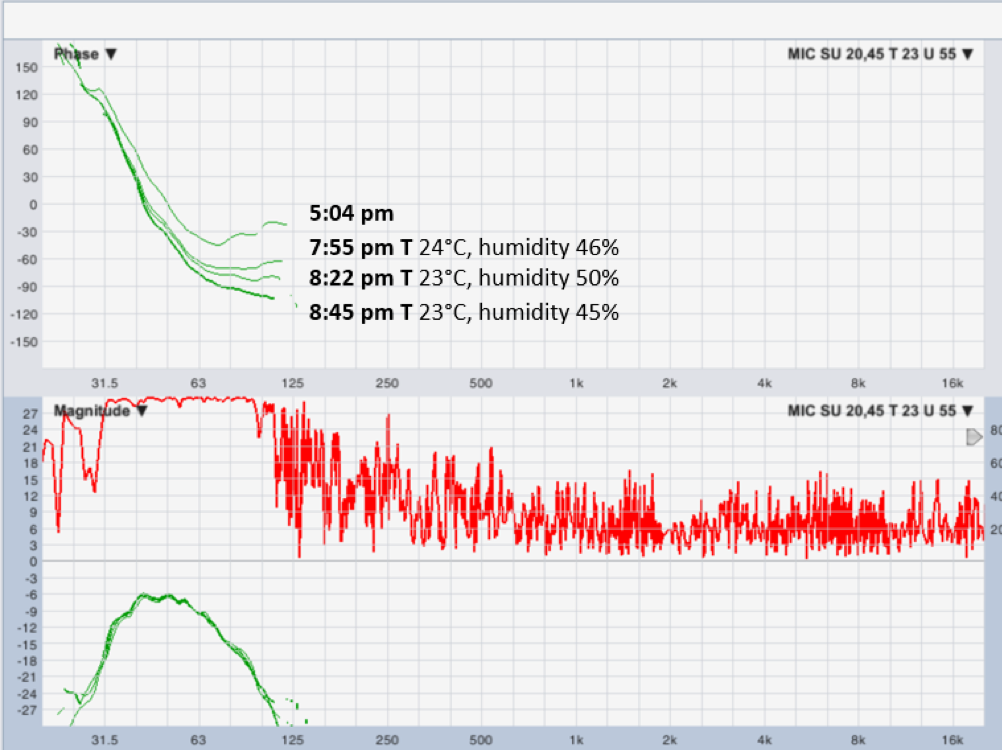
Figure 19 – All measurements compared
The increase between the afternoon measurement and the 19:55 measurement is significant, with a hypothetical thermal shock of about ten degrees and more. But in these conditions the large phase shift found, although it may also include temperature effects directly on the speed of sound, could easily be better explained by the effects of temperature on the microphone, with its thermal shock. The microphone, overheating because of exposure to the sun (and because it is attached to the metal structure of the layer), has significantly changed in response.
This observation applies to all subsequent measures of this research.
This is one of the aspects that will obviously have to be further investigated, with ad hoc measurements of the effects of temperature on the phase response of microphones exposed to variations in temperature and humidity. In the meantime, it may be useful to read this research and attached documents:
But the successive increases are equally significant, despite temperature variations of only one degree and no variation as in the case of the difference between the measures between 20:22 and 20:45.
I now ask you to pay attention to what happens in terms of magnitude. Zooming in on the traces of magnitude, we witness a progressive “extension” towards the bottom of the subwoofer response, as well as SPL increments and frequency response variations:
Upper microphone position – Impulse Response
We now move on to analyze the IR measurements for the upper microphone position. The recording of IR was made with Smaart V8, but to display the data below, we use Room EQ Wizard (1).
Below are the IRs relating to hourly measurements in Overlays:
- 17:08 hours
- 19:56 hours
- 20:45 hours
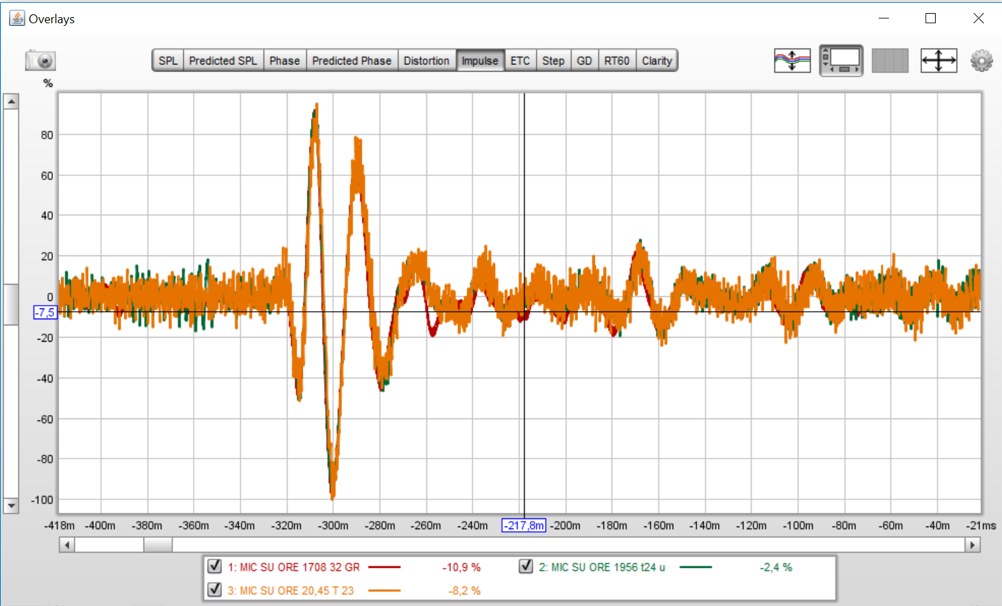
Figure 20 – IR Overlays in REW
A zoom on the tracks reveals an increasing time shifting with the filling of the room, with greatest significance at the highest frequencies in the band:
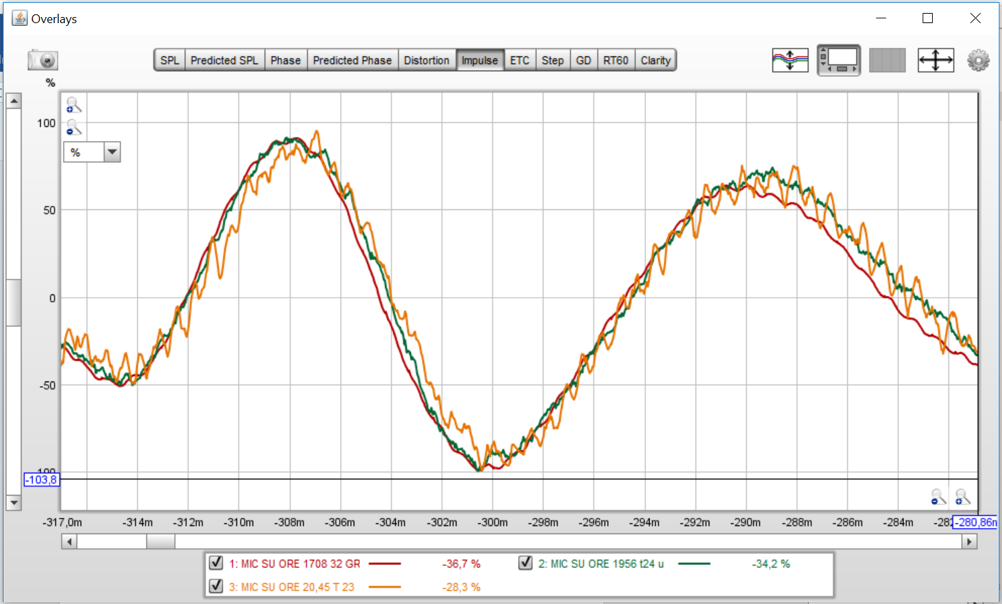
Figure 21 – Time Shifting starting from the highest frequencies
The direct look at the time domain confirms the trend observed in the frequency domain.
Bottom microphone position – Transfer Function
We proceed to the analysis of the measurements for the lower position. First measure; the empty room. All the previous conditions remaining the same, the TF screen in Smaart is displayed directly, with all the measurements in overlay:
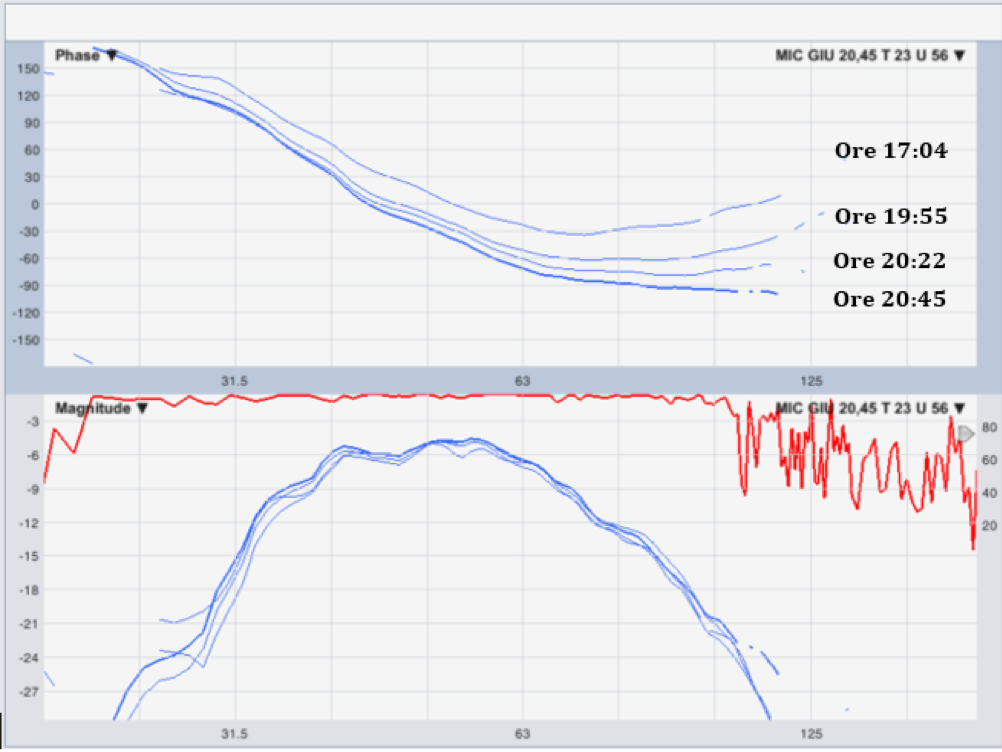
Figure 22 – TF relating to the lower microphone position
Also, in this case we are witnessing a progressive phase shift with increasing number of peoples.
Bottom microphone position – Impulse Response
For the same moments and under the same conditions as the previous paragraph, the IRs recorded with the lower microphone are examined. Below all the measurements displayed simultaneously in REW:
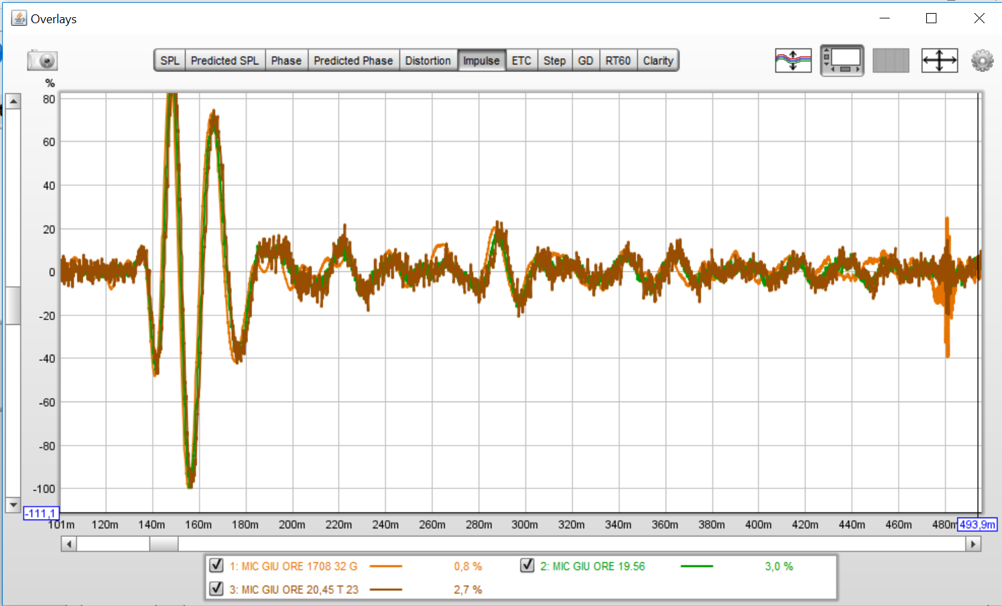
Figure 23 – All IR in REW
In this case, the look in the time domain shows the “temporal shifting” of the impulses associated with the progressive filling of the venue.
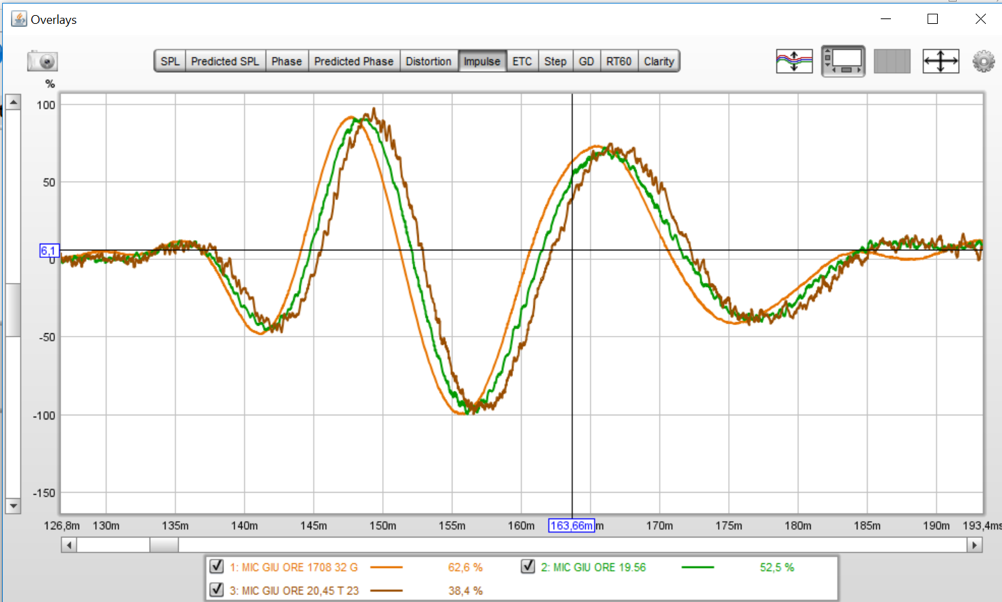
Figure 24 – Zoom of the IR in REW
STANDING AUDIENCE – 19 July 2019
On July 19th, a pop/rock concert was held in Cava del Sole, with the presence of about 5,000 people. The audience was standing. Below is the aerial photo of the venue, obviously without chairs.
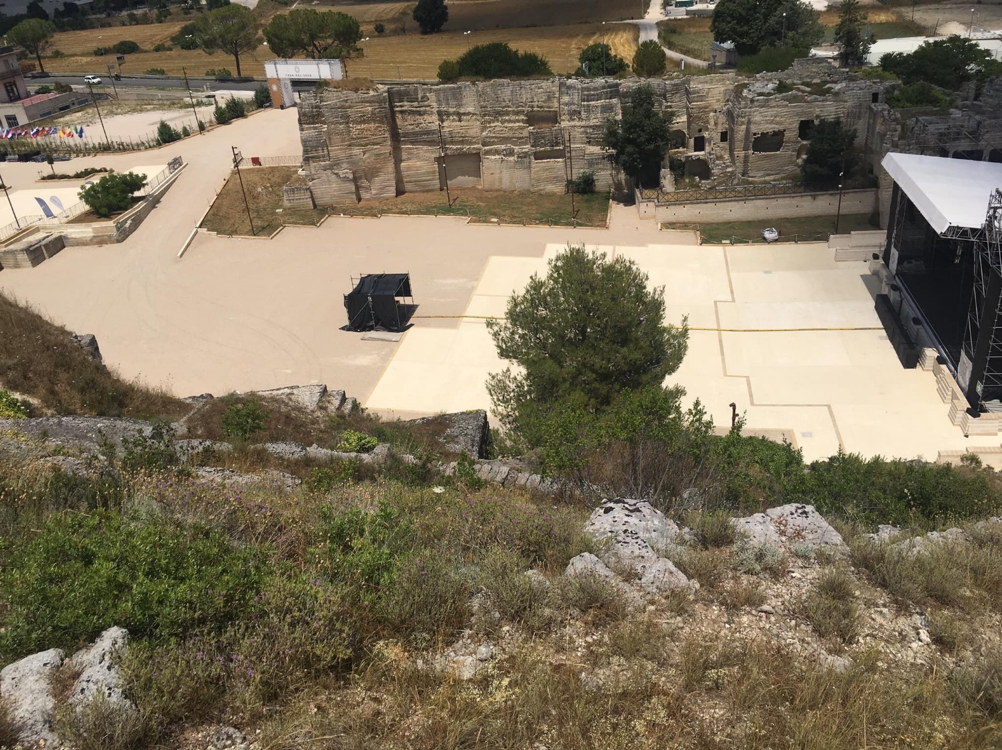
Figure 25 – Cava del Sole Arena, for the event of 19 July 2019
It should be emphasized that the subwoofer array, for this event, has changed slightly compared to the previous situation, having added a small number of subs (6), in an end-fire configuration. This is considered negligible for the purposes of this study.
In the evening, the public occupied the entire area between the FOH and the stage, with a large number of people scattered, even on its sides.
Upper microphone position – Transfer Function:
First, the measurement in the empty room:
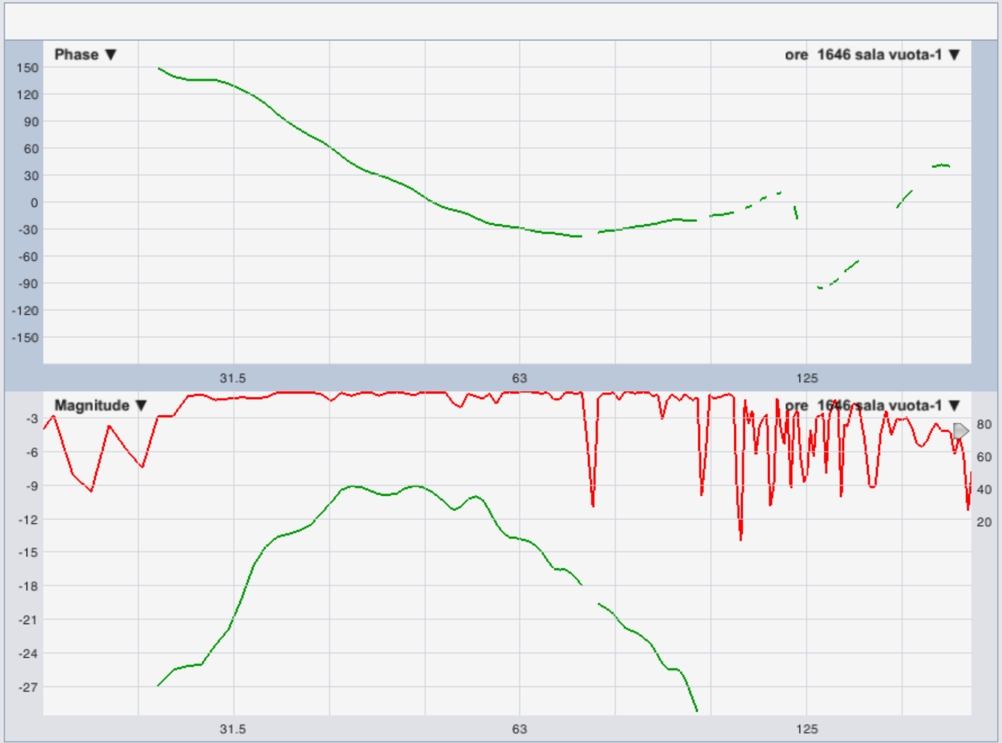
Figure 26 TF 16:46 pm, empty room. Upper microphone
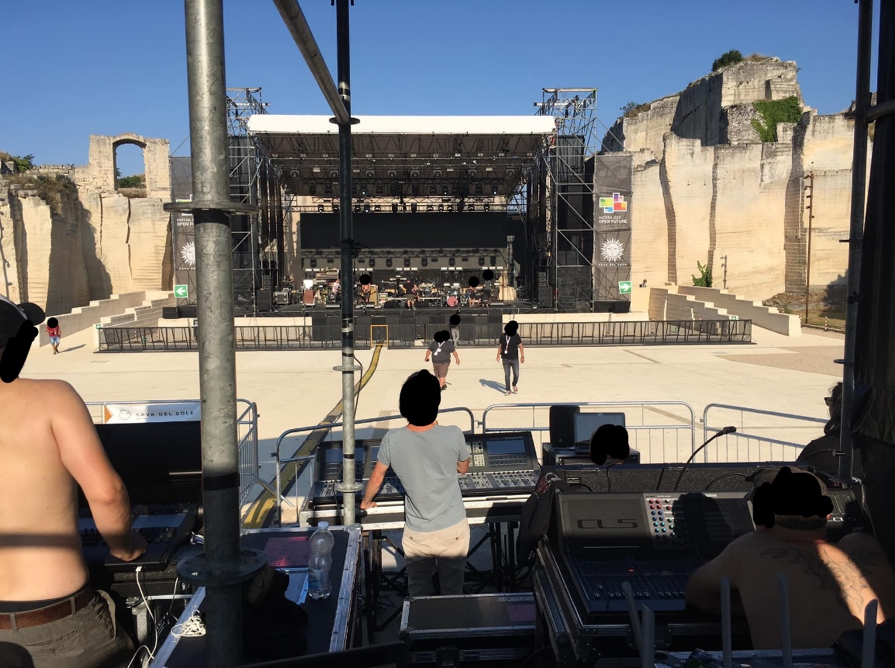
Figure 27 – First measurement with empty room
Second Measurement 19:50 hours…
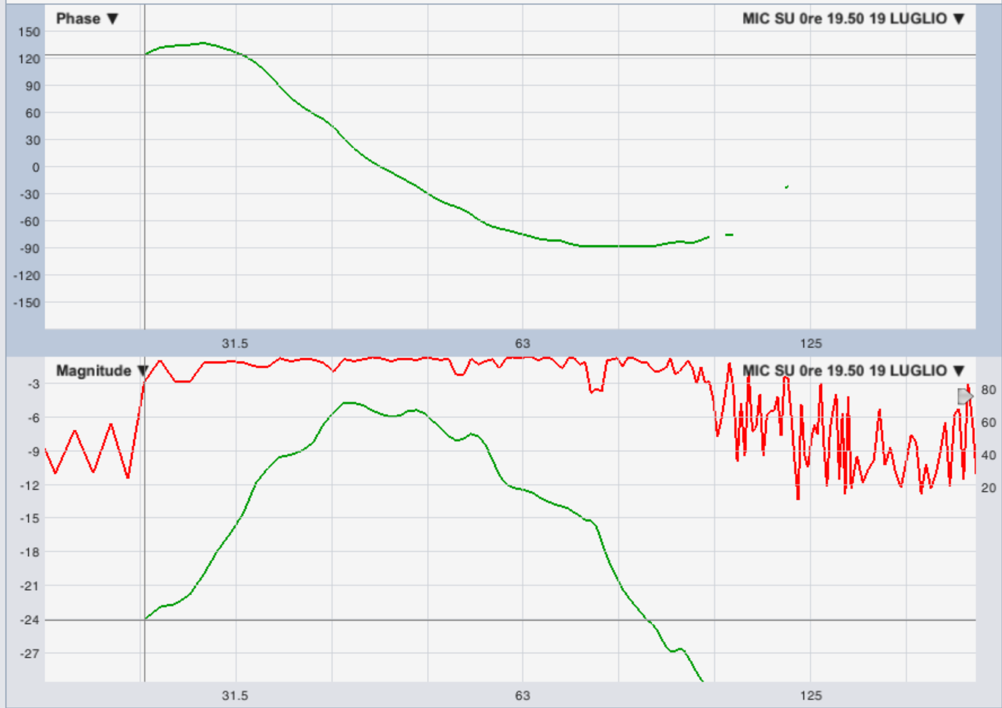
Figure 28 – TF 19:50 hrs. T 26 °, humidity 39%. Upper microphone
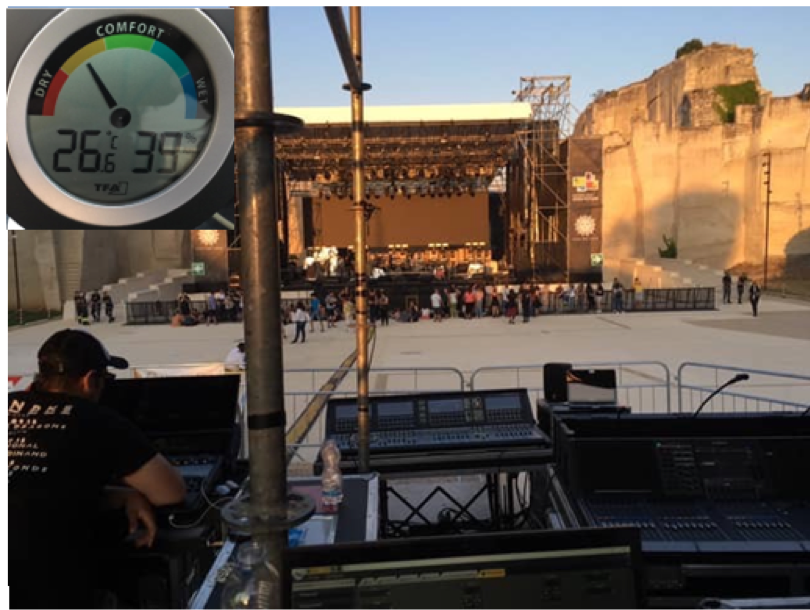
Figure 29 – The room at 7:50 T 26 °, humidity 39%
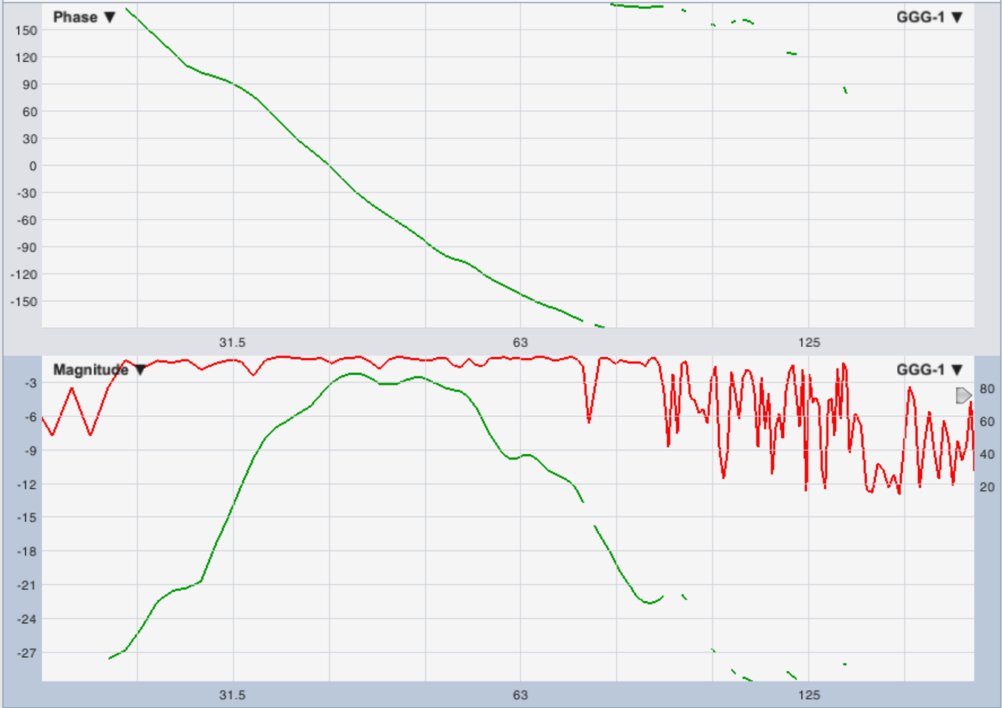
Figure 30 – TF at 21:15 pm, T 23 ° C, humidity 48%. Upper Microphone
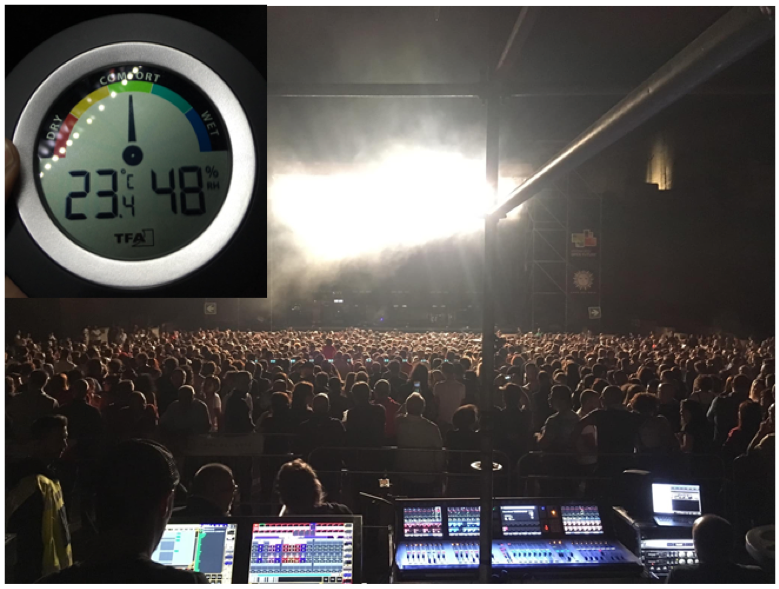
Figure 31 – 21:15 hours, pre-concert
And now, let’s compare the three measurements…
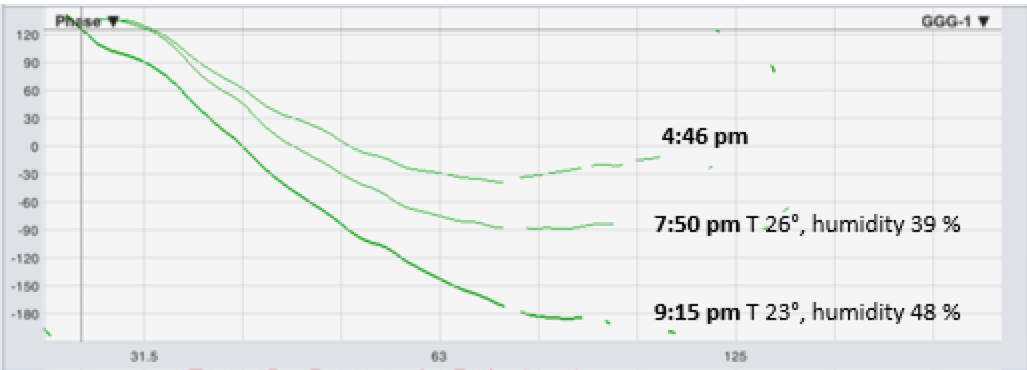
Figure 32 – TF relating to the upper microphone position
Bottom microphone position – Transfer Function
The conditions are the same as the previous ones. We therefore proceed to directly visualize all three measurements simultaneously in the same TF window, in Smaart.
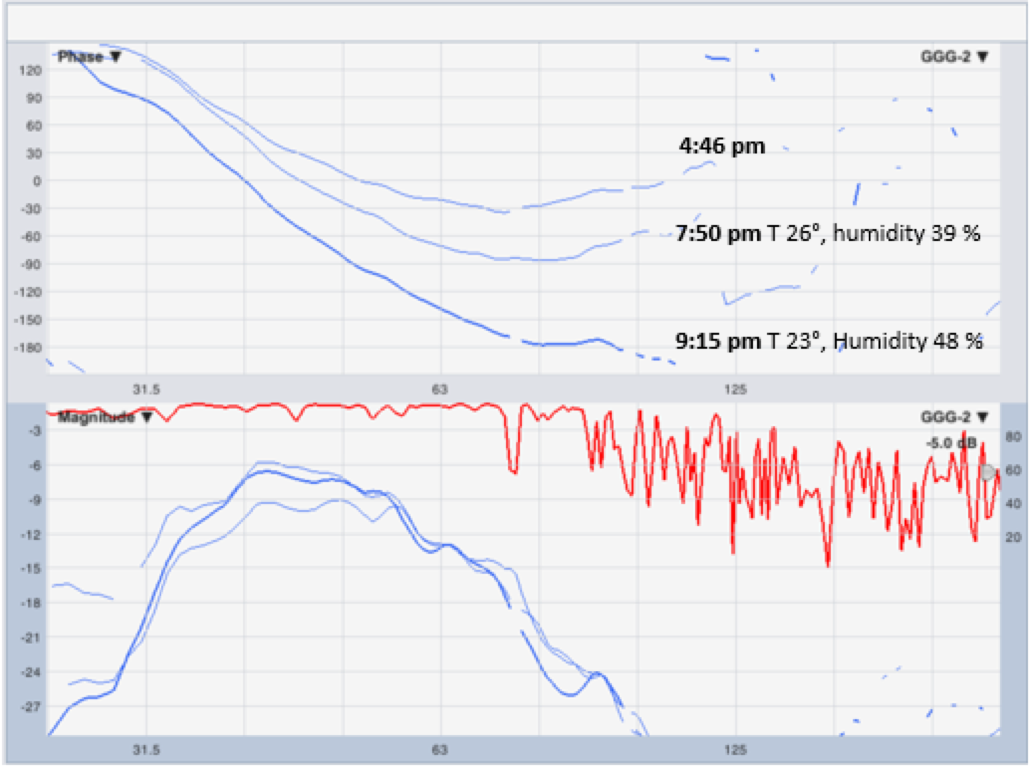
Figure 33 – TF relating to the lower microphone position
In this case, the effects of the audience appear to be much more incisive, enormously greater than the situation of the previous show. A significant phase shift appears which cannot be justified by changes in temperature and humidity. Even if the conditions have changed, the microphone positions are not exactly the same, one could try to compare the empty and full room measurements of the two types of concert. In this case, focusing on the details and exactness of the measures, we focus on the general trends of the same:
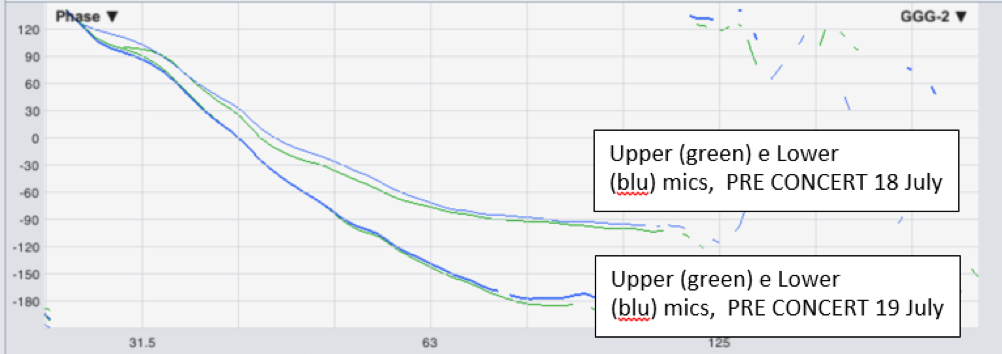
Figure 34 – TF, comparison between upper and lower microphone measurements, pre-concert, of the two days of 18 and 19 July
It appears evident that the large number of standing people, compacted and thickened between FOH and subwoofers, on July 19th, have the greatest effects in terms of delay for the component that crosses the porous layer of the public.
Even for the component that passes over the heads, there is a greater delay (due to the greater path traveled and the diffraction of the mass of people) in the situation of the concert with the greatest number of people.
Bottom microphone position – Impulse Response
On this day it was not possible to carry out IR measurements for all the scheduled moments. Only two IRs have been collected with Smaart: one at 16:46 and one at 20:20.
Below is a photo of the audience at 20:20
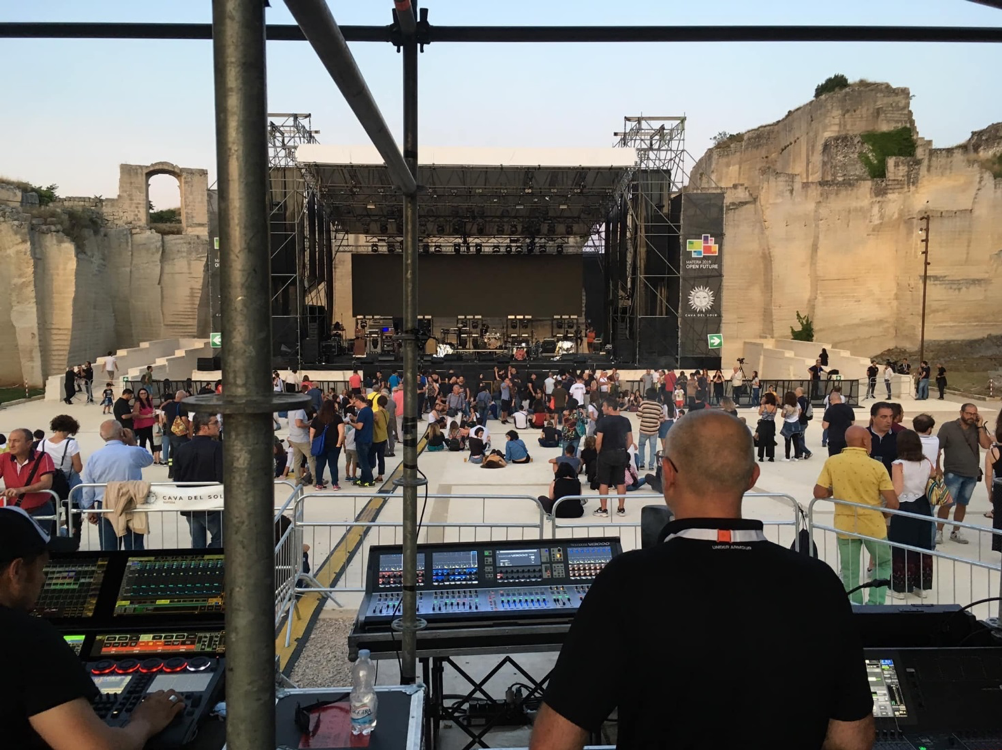
Figure 35 – The public at 20:20 hours on 19 July 2019
Shown below is the overlay screen in REW, with the IR measurements of 16:46 and 20:20 for the lower microphone position:
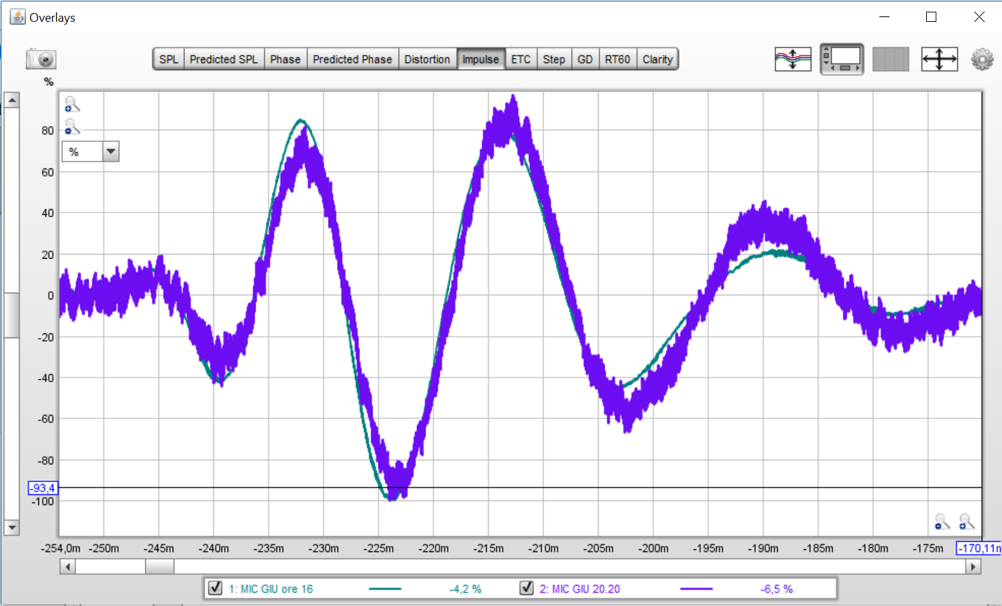
Figure 36 – IRs in REW
Also in this case, the look in the time domain shows the “temporal shifting” of the impulses, with the progressive filling of the venue.
Conclusions
The following survey, carried out with ordinary tuning tools, has shown that both the component of the wave fronts generated by the array of subwoofers that pass above the venue and those that cross the audience layer of peoples are delayed and slowed down on their way to the FOH.
For the upper component, this delay is smaller and can be explained essentially with the greater distance traveled – the greater the surface of the public, the greater the distance to be traveled. In the two types of concert it was shown that for this component the delay increases as the number of people increases. The condition of a concert with high density of standing public represents the situation in which the phenomenon is most evident.
For the component that crosses the public, the measured phase shift is obviously greater.
The standing and large audience of the concert on July 19, produces the greatest phase shift.
Variations in temperature and humidity – which in themselves are not very influential in the low frequency range – prove to be irrelevant in the overall economy of the phenomena observed (it is necessary to verify how much heating of the measurement microphones and modifications of the membrane of their capsule, have influenced the afternoon measurements).
It appears that the presence of the audience slows down the speed of the sound that passes through it, like a porous material.
It has emerged that, in general, subwoofer configurations in line in front of the stage, lead to a greater phase shift increase compared to traditional LR configurations (refer also to the measures by Emiliano Di Marco in the attached part).
The measurements performed are relative and indirect, performed with the ordinary tuning tools. This is to identify a simple and repeatable method, easily verifiable by all.
It is clear, however, that it is necessary to identify tools and methodologies capable of directly measuring such variations in speed of sound and the effects of tortuosity.
Also the aspect of the virtual extension of low frequency band needs further investigation.
These will be the goals of future research. fdm
The Author
Fedele De Marco, Sound Engineer.
Competent Technician in Acoustics.
Associate Member of AES and other national and international organizations and associations in the sector.
For several years he has been involved in research and dissemination in the field of applied acoustics and design & tuning of sound reinforcement systems, both through the pages of his blog, https://illatooscurodellafase.wordpress.com/ and on his social channels, that through seminars and workshops throughout Italy.
He gained experience in the field in various large events. He collaborates with some of the major Italian and international audio professional companies.
Bibliography:
Smaart: https://www.rationalacoustics.com/smaart/about-smaart/
AFMG SysTune:
RITA:
https://www.gaudiosolutions.com
– “ACOUSTIC PHENOMENA ASSOCIATED TO THE AUDIENCE” Ivana Rossell, Cristina Vicent Enginyeria i Arquitectura La Salle, Universitat Ramon Llull.
– Arau, Higini, ABC de la acústica arquitectónica, Ediciones Ceac.
– Barron, Michael, Auditorium acoustics and architectural design, E&Fn Spon
– Beranek, L.L, (1996), Concert & Opera Halls, (Acoustical Society of America)
– Carrión Isbert, A, Diseño acústico de espacios arquitectónicos, Ediciones UPC, 1998.
– D. Takahashi (1997). “Seat dip effect: The phenomenon and the mechanism”. J. Acoust. Soc. Am. 102,1326-1334.
– J. S. Bradley (1991). “Some further investigations of the SEAT dip effects”. J. Acoust. Soc. Am. 90, 324-333.
– K. Ishida, K. Sugino, and I. Masuda, “On the sound reflection of the auditorium seats,” Proc 13th I.C.A, Belgrade (1989), vol.2, 157-170.
– Schultz, T. J. and Watters, B.G., J (1964). Acoust. Soc. Am. 36, 885
– W. J. Davies and T. J. Cox (2000). “Reducing seat dip attenuation”, J. Acoust. Soc. Am. 108, 2211-2218.
– W. J. Davies and Y. W. Lam (1996). “New attributes of seat dip attenuation”.
– W. J. Davies, T. J. Cox, and Y. W. Lam (1996). “Subjective Perception of SEAT dip attenuation”. Acústica. 82, 784-792.
– Y. Ando, M. Takaishi, and K. Tada (1982). “Calculations of the sound transmision over theater seat and methods for its improvement in the low frecuency range”. J. Acoust. Soc. Am. 72, 443-448
– ElenaShabalina,MichaelVorländer. Influenceofaudienceonpropagationofsoundatlowfrequencies. Acoustics 2012, Apr 2012, Nantes, France. hal-00811159
– Biot, M. A. Theory of elastic wave propagation in a fluid saturated porous solid. I. Low-frequency range, J. Acoust. Soc. Am., 28 (2), 168–178, (1956). http://dx.doi.org/10.1121/1.1908239
– Biot, M. A. Theory of elastic wave propagation in a fluid saturated porous solid. II. Higher-frequency range, J. Acoust. Soc. Am., 28 (2), 179–191, (1956). http://dx.doi.org/10.1121/1.1908241
– Embleton, T. F. W., Piercy, J. E., and Olson, N. Outdoor sound propagation over ground of finite impedance, J. Acoust. Soc. Am., 59 (2), 267–277, (1976). http://dx.doi.org/10.1121/1.380882
– Allard, J. F. and Atalla, N. Propagation of Sound in Porous Media: Modelling of Sound Absorbing Materials, 2nd edition, John Wiley & Sons, Chichester, UK (2009).
– Miki, Y. Acoustic properties of porous materials: Generalization of empirical models, J. Acoust. Soc. Jap. (E), 11, 25–28, (1990). http://dx.doi.org/10.1250/ast.11.25
Matyka, M., Koza, Z., & Gołembiewski, J. (2014). The velocity distribution in a random porous medium.
