Latency Investigation
by Pat Brown
Latency is unavoidable in digital audio devices. Pat Brown assembles a simple signal chain and measures the latency between analog input and various outputs.
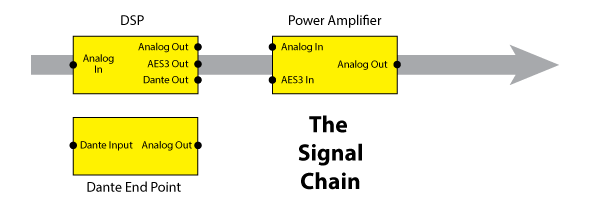
Latency is unintentional and unavoidable delay between the input and output of a component or signal chain. We all know that digital audio devices exhibit latency. The only question is “How much?” Most devices include the latency on the data sheet. Some don’t. I decided to assemble a simple signal chain and measure the latency between an analog input and various outputs (Fig. 1).
Fig. 1 – The Signal Chain
For instrumentation I used an RME Fireface UFX USB audio interface, along with the FIRCapture measurement program. A loopback test was performed on the interface, and serves as a reference for all of the other path measurements. The latency of the measurement system is compensated, so the loopback test results in an essentially perfect impulse at time zero.
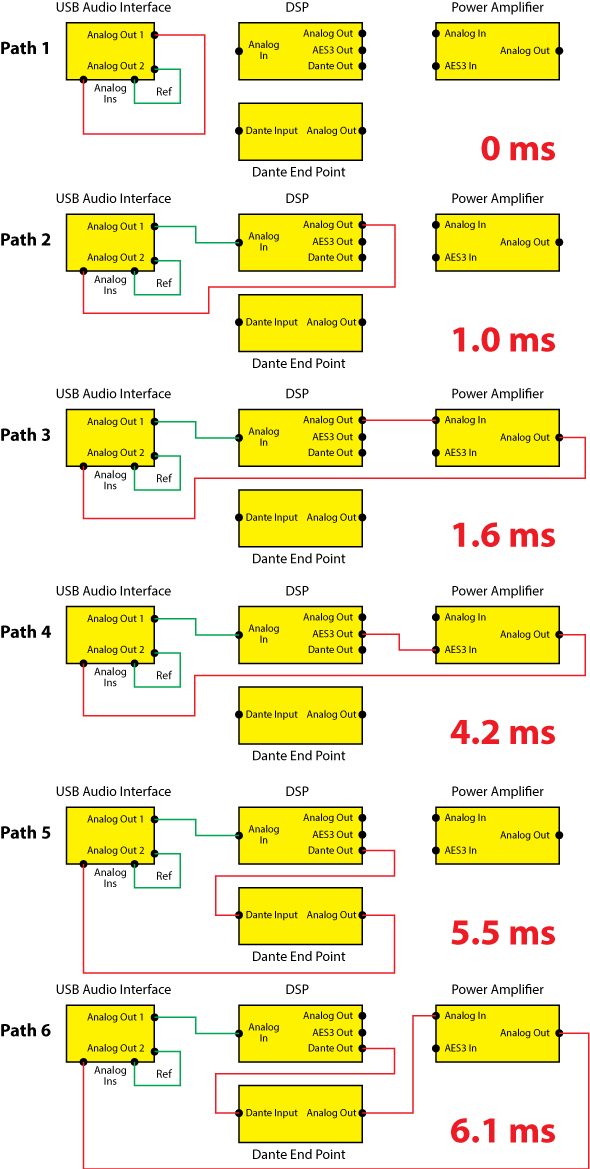
I proceeded to collect the impulse response from each output type found in the signal chain. These included analog, AES3, and Dante (Ethernet). The AES3 and Dante paths included a conversion back to analog, which would always be the case when the amplifier is driving a loudspeaker. The power amplifier was operated with the input sensitivity set to – 30 dB. This compensates for the 30 dB of voltage gain inherent to the amplifier, resulting in signal levels similar to the output of the DSP. Figure 2 shows the paths tested, along with the resultant latencies.
.
Figure 2 – The signal paths measured in the investigation
Here are a few details on how the measurements were conducted.
- Audio path only (no acoustic time-of-flight)
- No mixer
- Resultant levels normalized to the loopback level
- Dante configured for minimum latency
- DSP signal flow included some switching and PEQ filter blocks (IIR filters). The filters were bypassed.
- 1 GB network switch
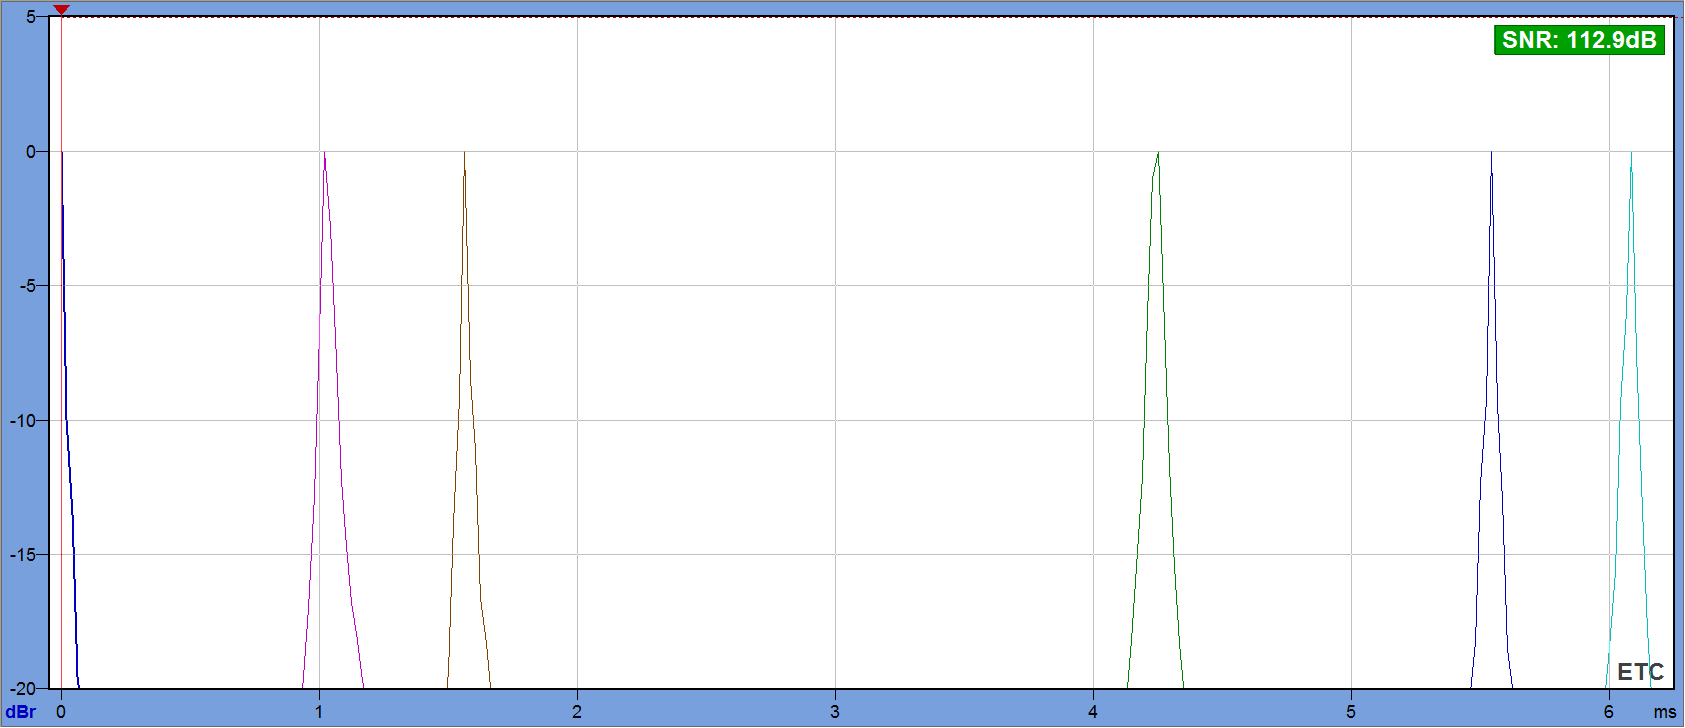
Figure 3 shows the ETC of each path. Note that the pulse shape is determined by the measurement window used, and is irrelevant. The arrival time is the parameter of interest.
Figure 3 – ETC of absolute arrival times (click to enlarge)
The Transfer Function
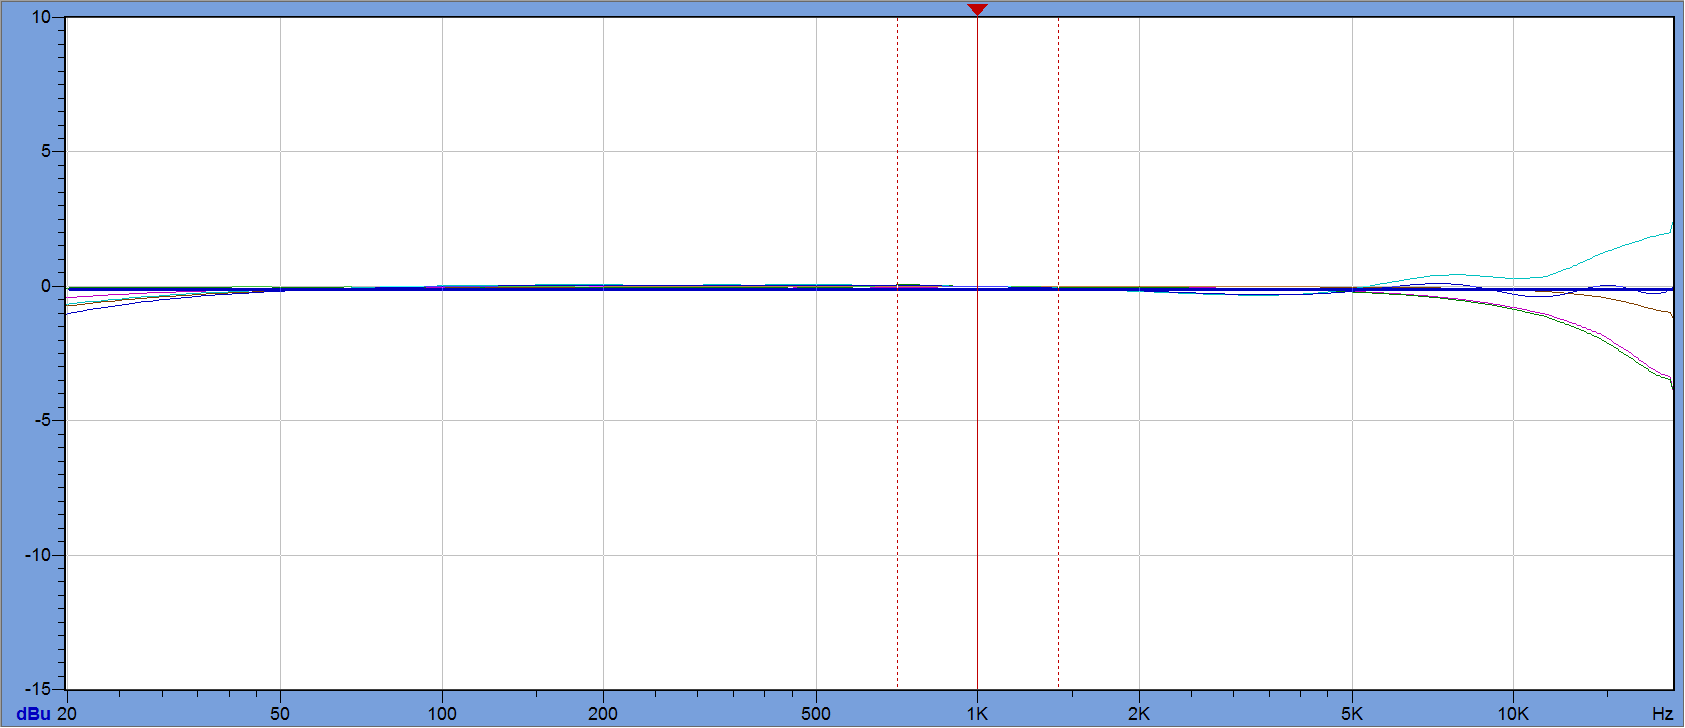
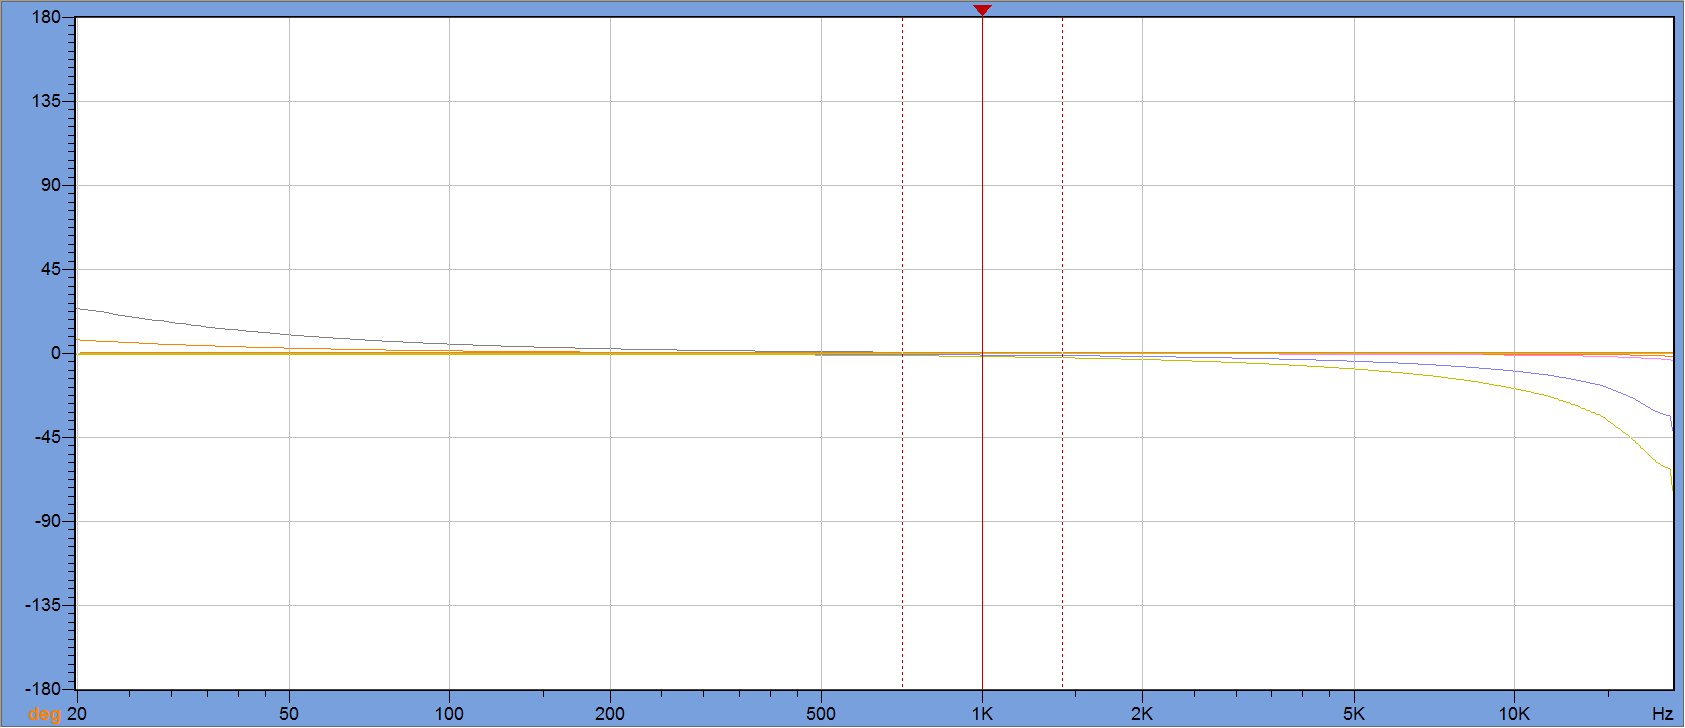
Figure 4 shows the frequency response magnitude of each arrival. Note that the measurements that included the power amplifier show a slight HF rise. This is likely due to the fact that the amplifier is a Class D topology and was not loaded. Figure 5 shows the excess phase response of each device, with the latency removed. The excess phase is the difference between the measured phase and the minimum phase response.
Figure 4 – The frequency response magnitude (click to enlarge)
Figure 5 – The frequency response excess phase (click to enlarge)
The Gear
Here is the equipment list used in the investigation. Of course the results will likely vary if different components are used.
- DSP: Symetrix Radius AEC
- Dante End Point: Atterotech unDIO2x2
- Power Amp: Lab Gruppen IPD 1200
The Take-aways
There are many upsides to the use of digital technology in sound reinforcement systems. One of the downsides is latency. Here are some important things to remember to assure that the performance of your system is not impaired by this unintentional and unavoidable delay.
- 1. Latency is easy to measure. If you are unsure about it, and need to know, perform the measurement as described above.
- 2. There is no universal agreement on the “latency budget” for a sound system. It is application-dependent. It is good design practice to keep it as low as possible.
- 3. None of the latencies measured in this study are eye-popping or unexpected. The numbers could be much higher if FIR filters were used in the DSP. A 1024 tap FIR filter (implemented in the DSP) could add another 10.7 ms of latency if used to linearize the phase response.
- 4. While room modeling programs can include time-of-flight in the predictions, it is unlikely that the designer will know the latency contribution at the design phase of a project. The setting of signal delays should always be done in situ and by measurement or listening.
pb

