RT Versus Frequency: Is There an Ideal Target?
by Richard Honeycutt
The reverberation time T60 varies with frequency. This is due to both the nature of sound absorbing materials and air absorption. The optimimum RT-to-Frequency ratio has long been discussed. Here is some history on the topic, along with a recent development.

Introduction
Ever since Wallace Sabine’s foundational research on scientific acoustics, professionals in the field have known that RT varies with frequency, due to the nature of sound-absorbing materials. The optimum contour of the RT-vs-frequency plot for a venue has been much discussed. Since at least as early as the 1932 publication of Vern Knudsen’s Architectural Acoustics, opinions have been offered by experts in the field. Knudsen addressed the question for speech rooms by breaking it into three criteria:
- the frequency distribution of energy in speech
- the relation between loudness and sound level (as illustrated by the Fletcher-Munson-Robinson-Dadson curves[i])
- human adaptation to the acoustics of furnished rooms
I believe most acousticians would agree that we should certainly add speech intelligibility to those criteria.
Knudsen suggested a criterion for an ideal speech room in which the RT varied smoothly from about 2.5 seconds in the 63-Hz band, to a minimum of 1.25 seconds in the 500- and 100-Hz bands, back up to 2.5 seconds in the 8-kHz band[ii]. For most speech venues, most acousticians today recommend an RT that varies as little as possible with frequency, given the realities of the materials available to us.
Successful music halls have varying frequency contours of RT. Though I unfortunately do not recall the details of the event, I know that a prominent music hall in England was reputed to have an objectionably thin sound, which was traced to the present wood floor having been installed over a previously installed carpet and underpad. This construction absorbed disproportionate amounts of bass energy and resulted in too-short low-frequency RT’s.
Bass Ratio
Beranek introduced the concept of Bass Ratio (BR)—the ratio of the average RT in the 125- and 250-Hz bands to the average RT in the 500- and 1000-Hz bands. He found that in the halls rated best by listeners, BR is greater than 1.0[iii]. I was taught that the RT-vs-frequency characteristic of a venue will always vary with frequency, and the nature of the acceptable or allowable variation depend upon the use of the hall. For pipe organ or most choir music, a higher BR is preferable. For speech, a BR of precisely unity is desirable, though not always achievable. Preferred ranges of bass ratio have been offered by other commenters: “The preferred values of the BR in a concert hall are between 1.1 to 1.25 for halls with high RT’s, and 1.1 to 1.45 for halls with RT’s of less than 1.8 sec.”[iv] Treble Ratio (TR) is similar measure that has been suggested for high-frequency RT contours. It is the average of the RT in the 2- and 4-kHz bands, divided by the average RT in the 500- and 1000-Hz bands. No consensus has been reached on an optimum value of TR.
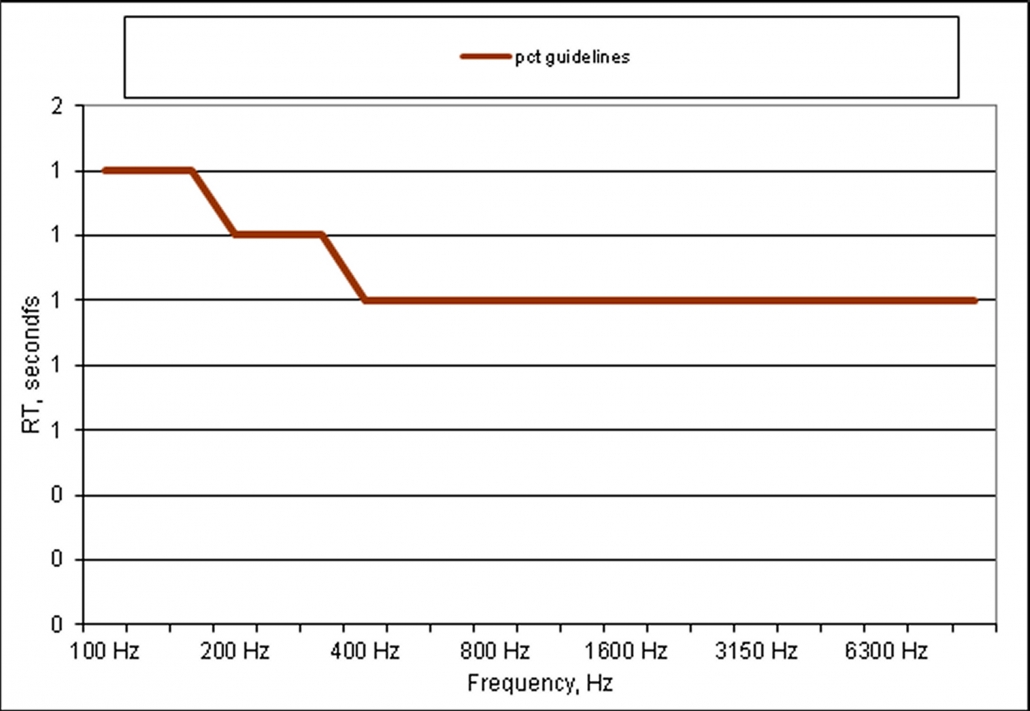 Figure 1: Sample RT-vs-frequency Plot with Lowest Two Bands Having Maximum Acceptible RT’s
For contemporary music, especially amplified music or music containing lots of percussion, the BR ought not to be much above unity. Specifically, the rule-of-thumb guideline used by many acoustical consultants is that for most venues, RT in the 125-Hz band should not exceed 140% of the mid-range RT, and in the 250-Hz band, it should not exceed 120% of the mid-range value. Figure 1 illustrates an RT contour with these low-frequency RT maxima.
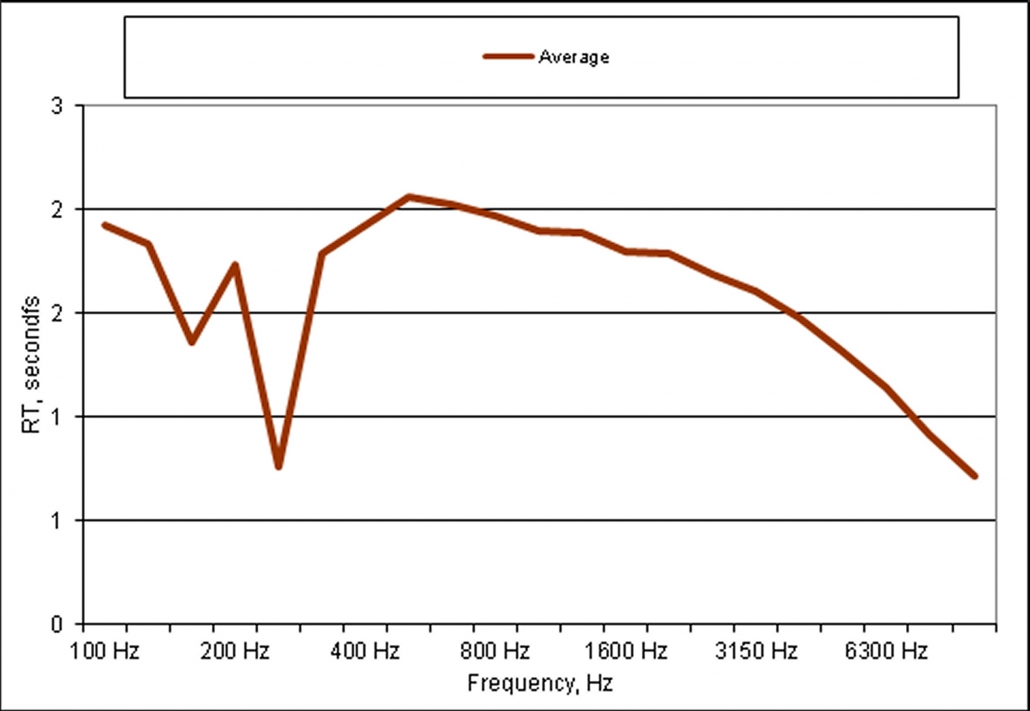 Figure 2: Measured RT-vs-Frequency in Sanctuary
Contrary to Knudsen’s advice, a TR of unity is considered by many consultants to be optimum for almost all speech venues.
An example from my own practice may prove illuminating. In 2008, I was contacted by a medium-sized church because their organ seemed not to be loud enough. The organ technician told them the problem was the acoustics of the room. The measured RT in the room is shown in Figure 2.
Notice the severe dip in the low mid-range, and the low RT at the lowest frequencies. The cause of these was determined to be cracks that had opened in the V-groove ceiling, creating a narrow-band absorber. An auralization of an acoustical model of the sanctuary, using a sampled anechoic organ as the source file is provided as “organ 250 dip.wav”.
For comparison, the RT-vs-frequency plot of the model with materials adjusted for as nearly a flat RT contour as possible is shown in Figure 3.
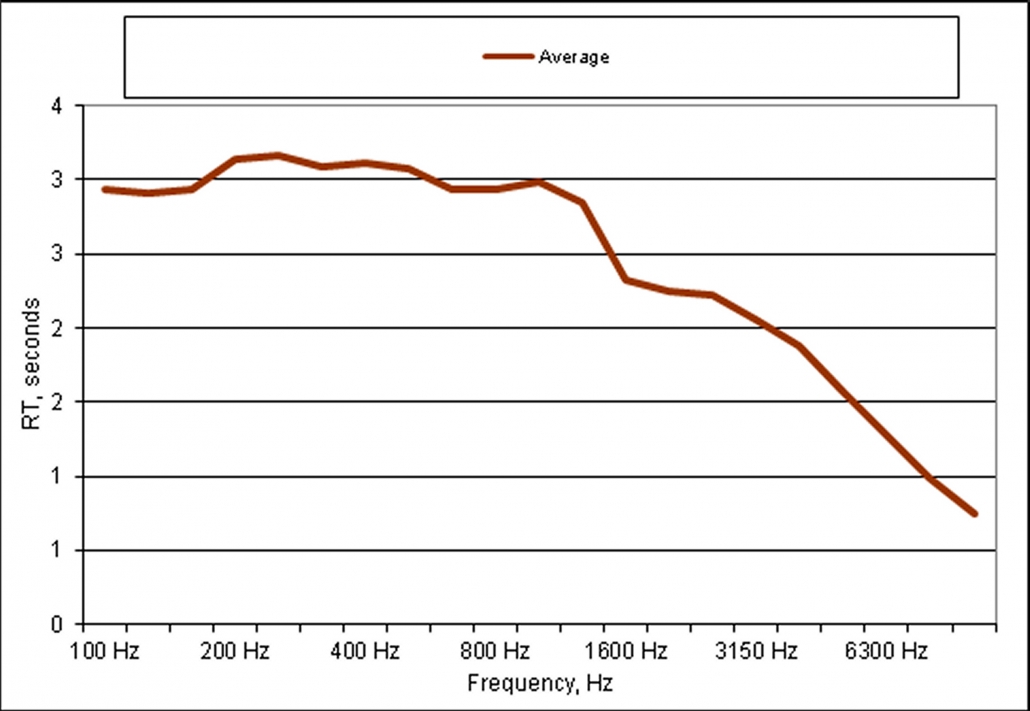 Figure 3: Pretty Flat RT Contour
Probably most venues with pipe organs that I see have high BR’s and low TR’s, and have a characteristic similar to that shown in Figure 4.
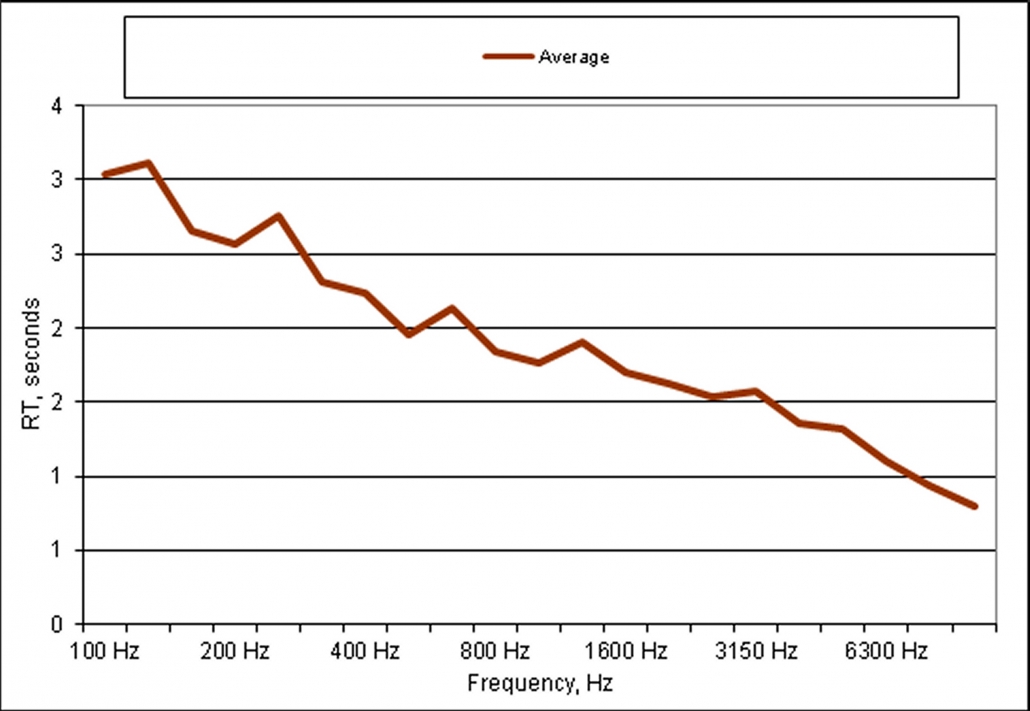 Figure 4:” Typical” RT Contour
Here’s some WAV files for comparison.
1. The source .wav file is “organ anechoic sample.wav”.
2. The “typical” sound clip is “organ normal RT.wav”.
3. Organ “250 Hz dip” RT
4. Organ “flat” RT
Common opinion is that the differences you can clearly hear in the sound clips come from differences in the frequency content caused by differing RT contours. The FFT’s of the sound clips shown in Figures 5-8 illustrate that even though you can see slight differences in frequency content among the four clips, these are far less obvious than the difference in sound, so it is likely that temporal effects are in play in the human hearing system as well.
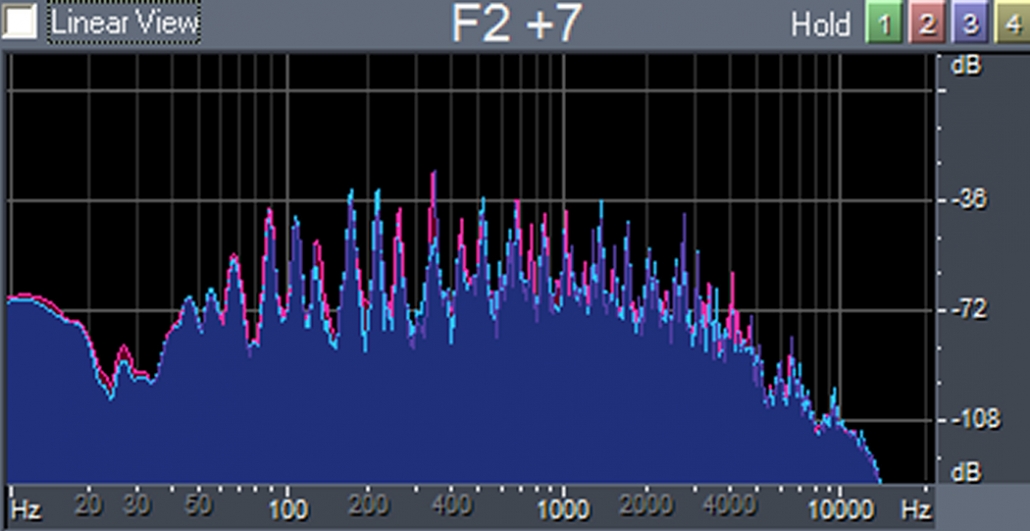 Figure 5: FFT of Room with 250-Hz Dip in RT
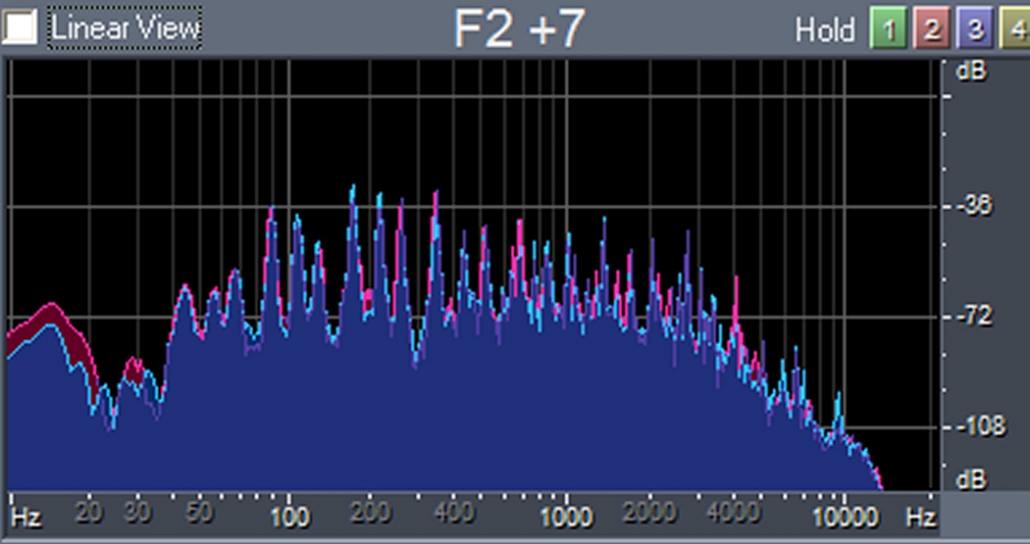 Figure 6: FFT of Room with Pretty Flat RT Contour
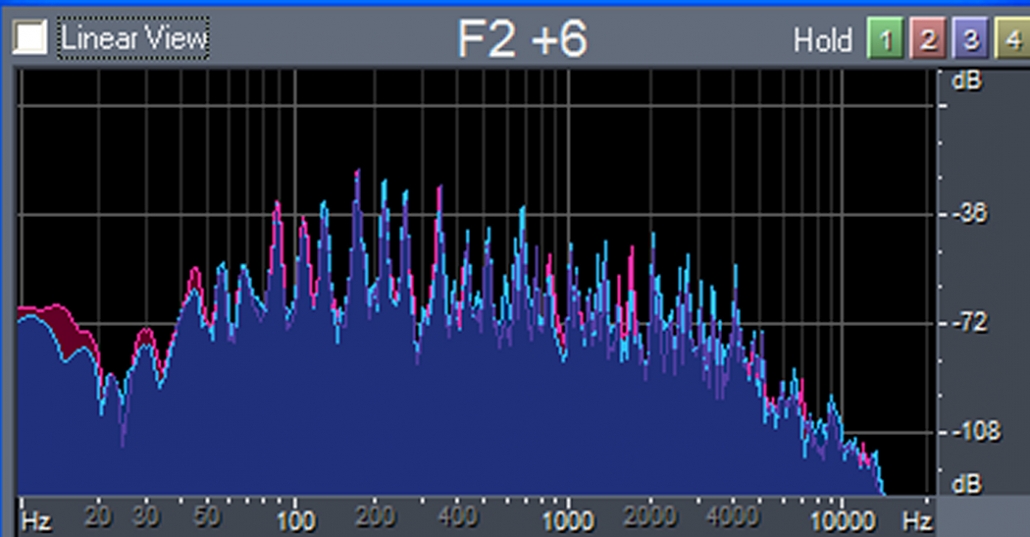 Figure 7: FFT of room with “Typical” RT Contour
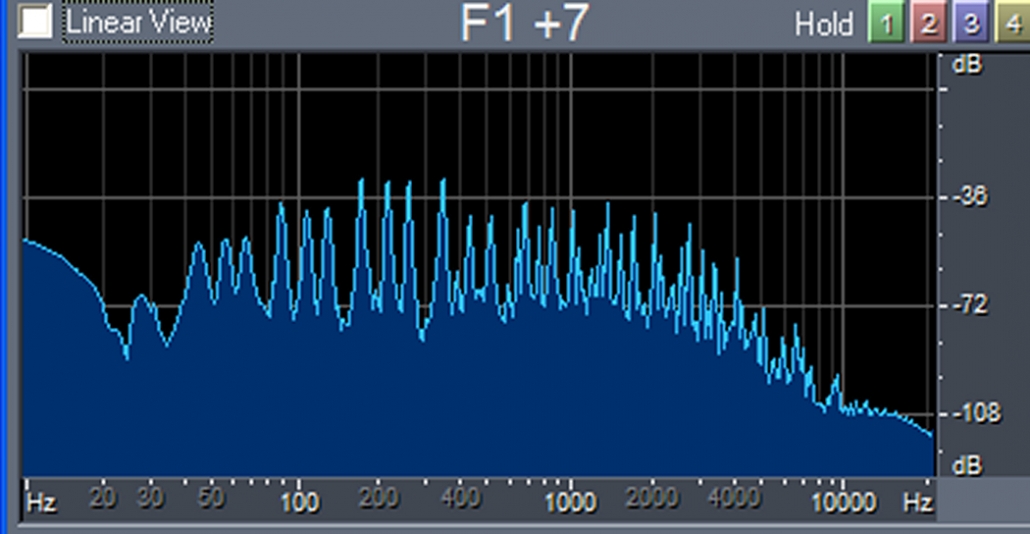 Figure 8: FFT of Anechoic Source
T60 Slope Ratio
Recently, Michael Fay shared his upcoming ASA paper with the SAC list-serv. In this paper, he introduces a simplified method of quantifying the RT-vs-frequency characteristic; he calls this metric the T60 Slope, and it is the ratio of the highest to the lowest octave-band RT’s measured or predicted in a venue[i]. Limiting his discussion to venues for amplified music, he offers a scoring scale in which the T60 Slope ranges from 1.00 (Good) to “above 1.70” (Bad).
Comparing the examples presented in this blog, we obtain the results shown in Table A below:

The second and third columns give the percentage by which the RT in the 125- and 20-Hz bands exceeds the mid-band RT. Note that the T60 Slope is probably not applicable for the problematic room having the pronounced 250-Hz dip in RT, since the highest RT occurs in the 400-Hz octave band.
While the “Typical” room sounds pretty good for pipe organ, and probably for most choir music as well, it does not meet either the rule-of-thumb guideline or Fay’s T60 Slope guideline. So while different program material may require different RT contours, in rooms not having gross deficiencies (lots of narrow-band absorption), the common design guidelines and the T60 Slope method give comparable results, as long as the room has an RT contour that slopes gradually downward as frequency rises. rh
[1]Richard Honeycutt, Acoustics in Performance, Elektor, 2018; pp. 19-20
[1] Vern Knudsen, Architectural Acoustics, Wiley, 1932; 384ff.
[1] Leo Beranek, Concert and Opera Halls: How they Sound:, Acoustical Society of America, 1996, Table 8.5
[1] http://www.av-info.eu/
[1] Michael Fay, “Reverberation design goals for Modern Architectural Acoustic Environments”, www.gracenoteds.com
 Richard A. Honeycutt developed an interest in acoustics and electronics while in elementary school. He assisted with film projection, PA system operation, and audio recording throughout middle and high school. He has been an active holder of the First Class Commercial FCC Radiotelephone license since 1969, and graduated with a BS in Physics from Wake Forest University in 1970, after serving as Student Engineer and Student Station Manager at 50-kW WFDD-FM. His career includes writing engineering and maintenance documents for the Bell Telephone System, operating a loudspeaker manufacture company, teaching Electronics Engineering Technology at the college level, designing and installing audio and video systems, and consulting in acoustics and audio/video design. He earned his Ph.D. in Electroacoustics from the Union Institute in 2004. He is known worldwide as a writer on electronics, acoustics, and philosophy. His two most recent books are Acoustics in Performance and The State of Hollow-State Audio, both published by Elektor.
