What’s Wavelength and When Does It Matter?
by Richard Honeycutt
Richard takes it back to the first principles and explains the effect of the wavelength of a sound wave.
Recent discussions on the SAC listserv indicate some confusion surrounding the effect of the wavelength of a sound wave. So let’s take a trip back to first principles; even if we already know this stuff, maybe we can understand it in a new way.
There are many kinds of oscillating mechanical systems: a mass bouncing on a spring, a pendulum, a plucked guitar string, sound in air, etc. In all these examples, some mass moves back and forth between two extremes. We often simplify our analysis by considering the position as a function of time, with the motion being confined to a single frequency. When we graph this motion, we get the familiar sine wave.
Only the latter two examples involve propagating waves. If you displace a guitar string near the bridge of the instrument, then release it, the displaced portion of the string will quickly return to its rest position, then move beyond the rest position to an opposite displacement, and so forth. While it is doing this, a mechanical wave quickly travels along the string, displacing parts of the string that were originally at rest. This wave will be reflected where the string passes over the nut (little ivory or plastic “upper bridge”) and then back and forth along the length of the string. Depending upon the length, mass per unit length, and tension of the string, these reflected waves will reinforce at certain points along the string, and cancel at other points, forming a standing wave in the string. If photographically freeze-framed, the string’s motion would exhibit displacement that was essentially zero at some points, and maximum at other points. The locations of these minima and maxima would not change significantly as the wave motion continues.
The air molecules touching the string will also be forced into motion as the string bumps into them. Since the string’s motion is reciprocating, the air will not be pumped in a single direction, but will also reciprocate, bouncing back and forth. We can describe the molecules’ motion in three ways:
- (1) The air molecules or particles have a time-varying displacement.
- (2) The moving molecules have a time-varying velocity.
- (3) The pressure at any point in the air varies with time.
The time required for a point on the string to move from zero displacement to maximum displacement, back to zero, then to maximum displacement in the opposite direction, then back to zero, is called the period (T) of the wave in the string. It is measured in seconds, and can be thought of as seconds per cycle. The inverse of the period is the frequency (f), and is measured in cycles per second, or Hz. The length in meters between two points of maximum displacement in a single direction is the wavelength (λ), given by λ=c/f., where c is the speed of the wave in the string. Sometimes we talk about a wave number k, given by k=2π/λ, which has units of inverse meters. The wave number can be thought of as a sort of spatial frequency, or radians per meter. (1 cycle = 2π radians.)
The acoustic wave in the air adjacent to the string has the same frequency and period as the wave in the string, but the wavelength is different, because the speed of the wave is slower in air than in the string.
It is essential to notice a difference between the wave in the string and the sound wave. The particle displacement in the string is from side to side, while the wave propagates along the length of the string: the particle motion is transverse to the wave propagation. In contrast, the air molecules move away from, than back toward the source of sound, or longitudinally with the direction of wave propagation. In certain respects, longitudinal waves behave differently from transverse waves.
Unless there’s a breeze or fan, the long-term net motion of the air molecules is zero; each molecule moves away from the source, then back towards the source, until the motion dies out. In most acoustical considerations, we are interested in the acoustic pressure variation: the increase/decrease of instantaneous pressure with time. But for now, let’s look at the particle velocity.
Figure 1 shows a blind tube containing air and driven by a reciprocating piston. Below the illustration of the tube, there is a graph of the particle velocity. Notice that the velocity is zero at the right-hand end of the tube, as we would expect, since air molecules are not able to flow into and out of the wall at the end of the tube. The maximum particle velocity occurs at 1/4 and ¾ wavelengths from the wall at the end of the tube. This always happens when a longitudinal wave is reflected from any boundary.
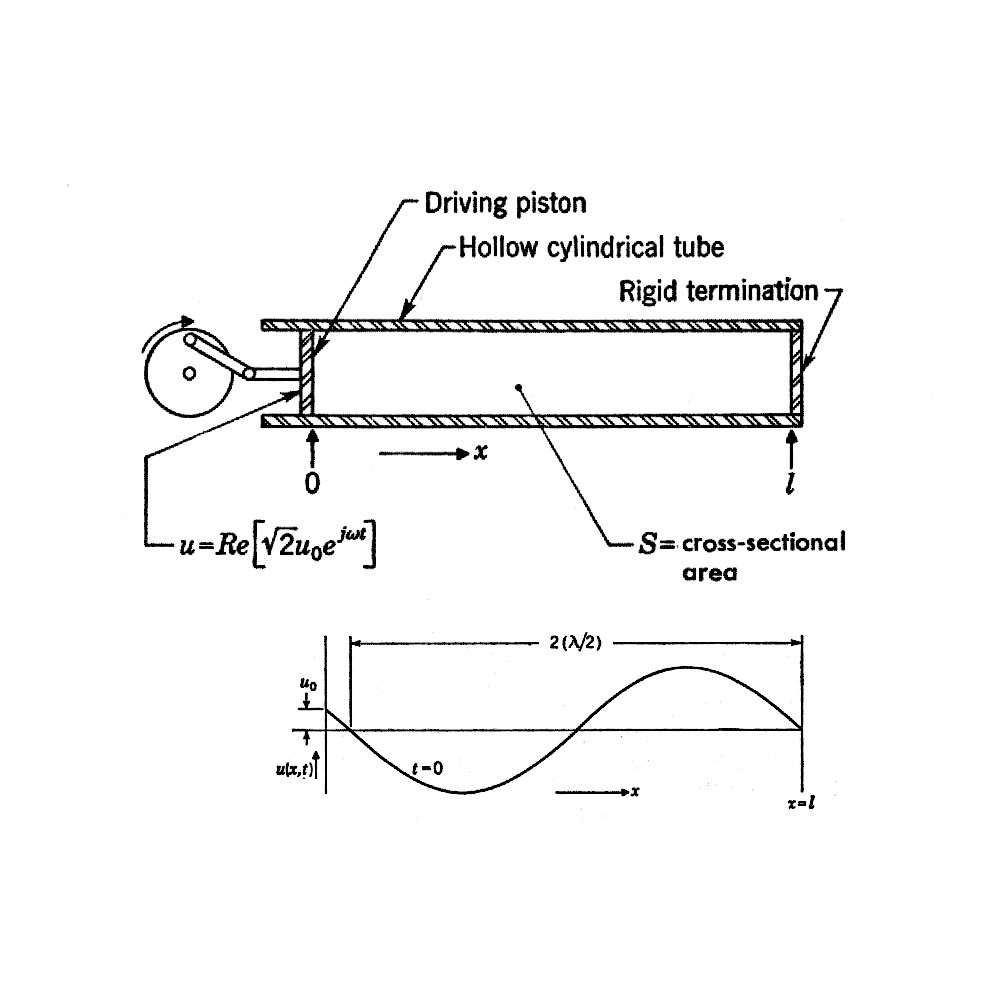
Figure 1: The graphed curve shows the velocity of the air molecules at each position in the tube for the sound wave created by the reciprocating piston.
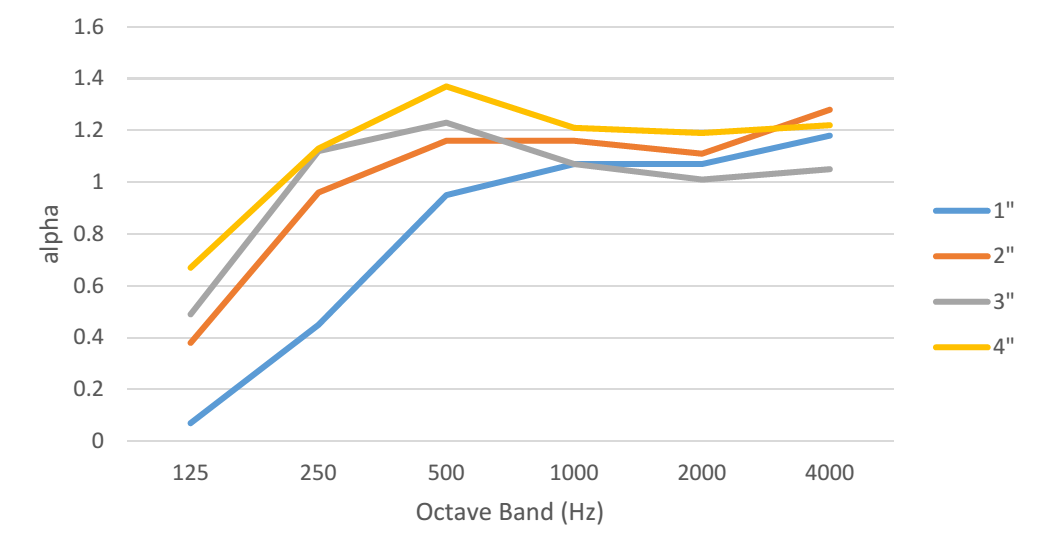
Now let’s think about a sound source in a room with a rigid wall, and a sheet of compressed (porous) fiberglass material mounted between the source and the wall. If the fiberglass is mounted directly to the wall, the attenuation only depends upon the internal friction of the fiberglass, and the particle velocity. Thus a thin absorber is only exposed to low particle velocity; and a thicker one, to higher velocity, since the farther the particle is from the wall, the higher its velocity, up to a distance of λ/4. Figure 2 shows plots of the material absorption α versus frequency for 1″, 2″, 3″, and 4″ fiberglass mounted directly to a rigid wall. In a later blog, we’ll discuss what an alpha >1 can mean!
If the fiberglass is spaced out from the wall, the situation becomes more interesting. When the air molecules pass through the fiberglass, friction causes them to lose energy, and since frictional losses depend upon velocity, the loss will be greatest at the points of greatest velocity in the reflected wave. Note in Figure 3 that the original wave enters from the right and passes through the fiberglass, in which it is attenuated by α, the absorption coefficient of the fiberglass.
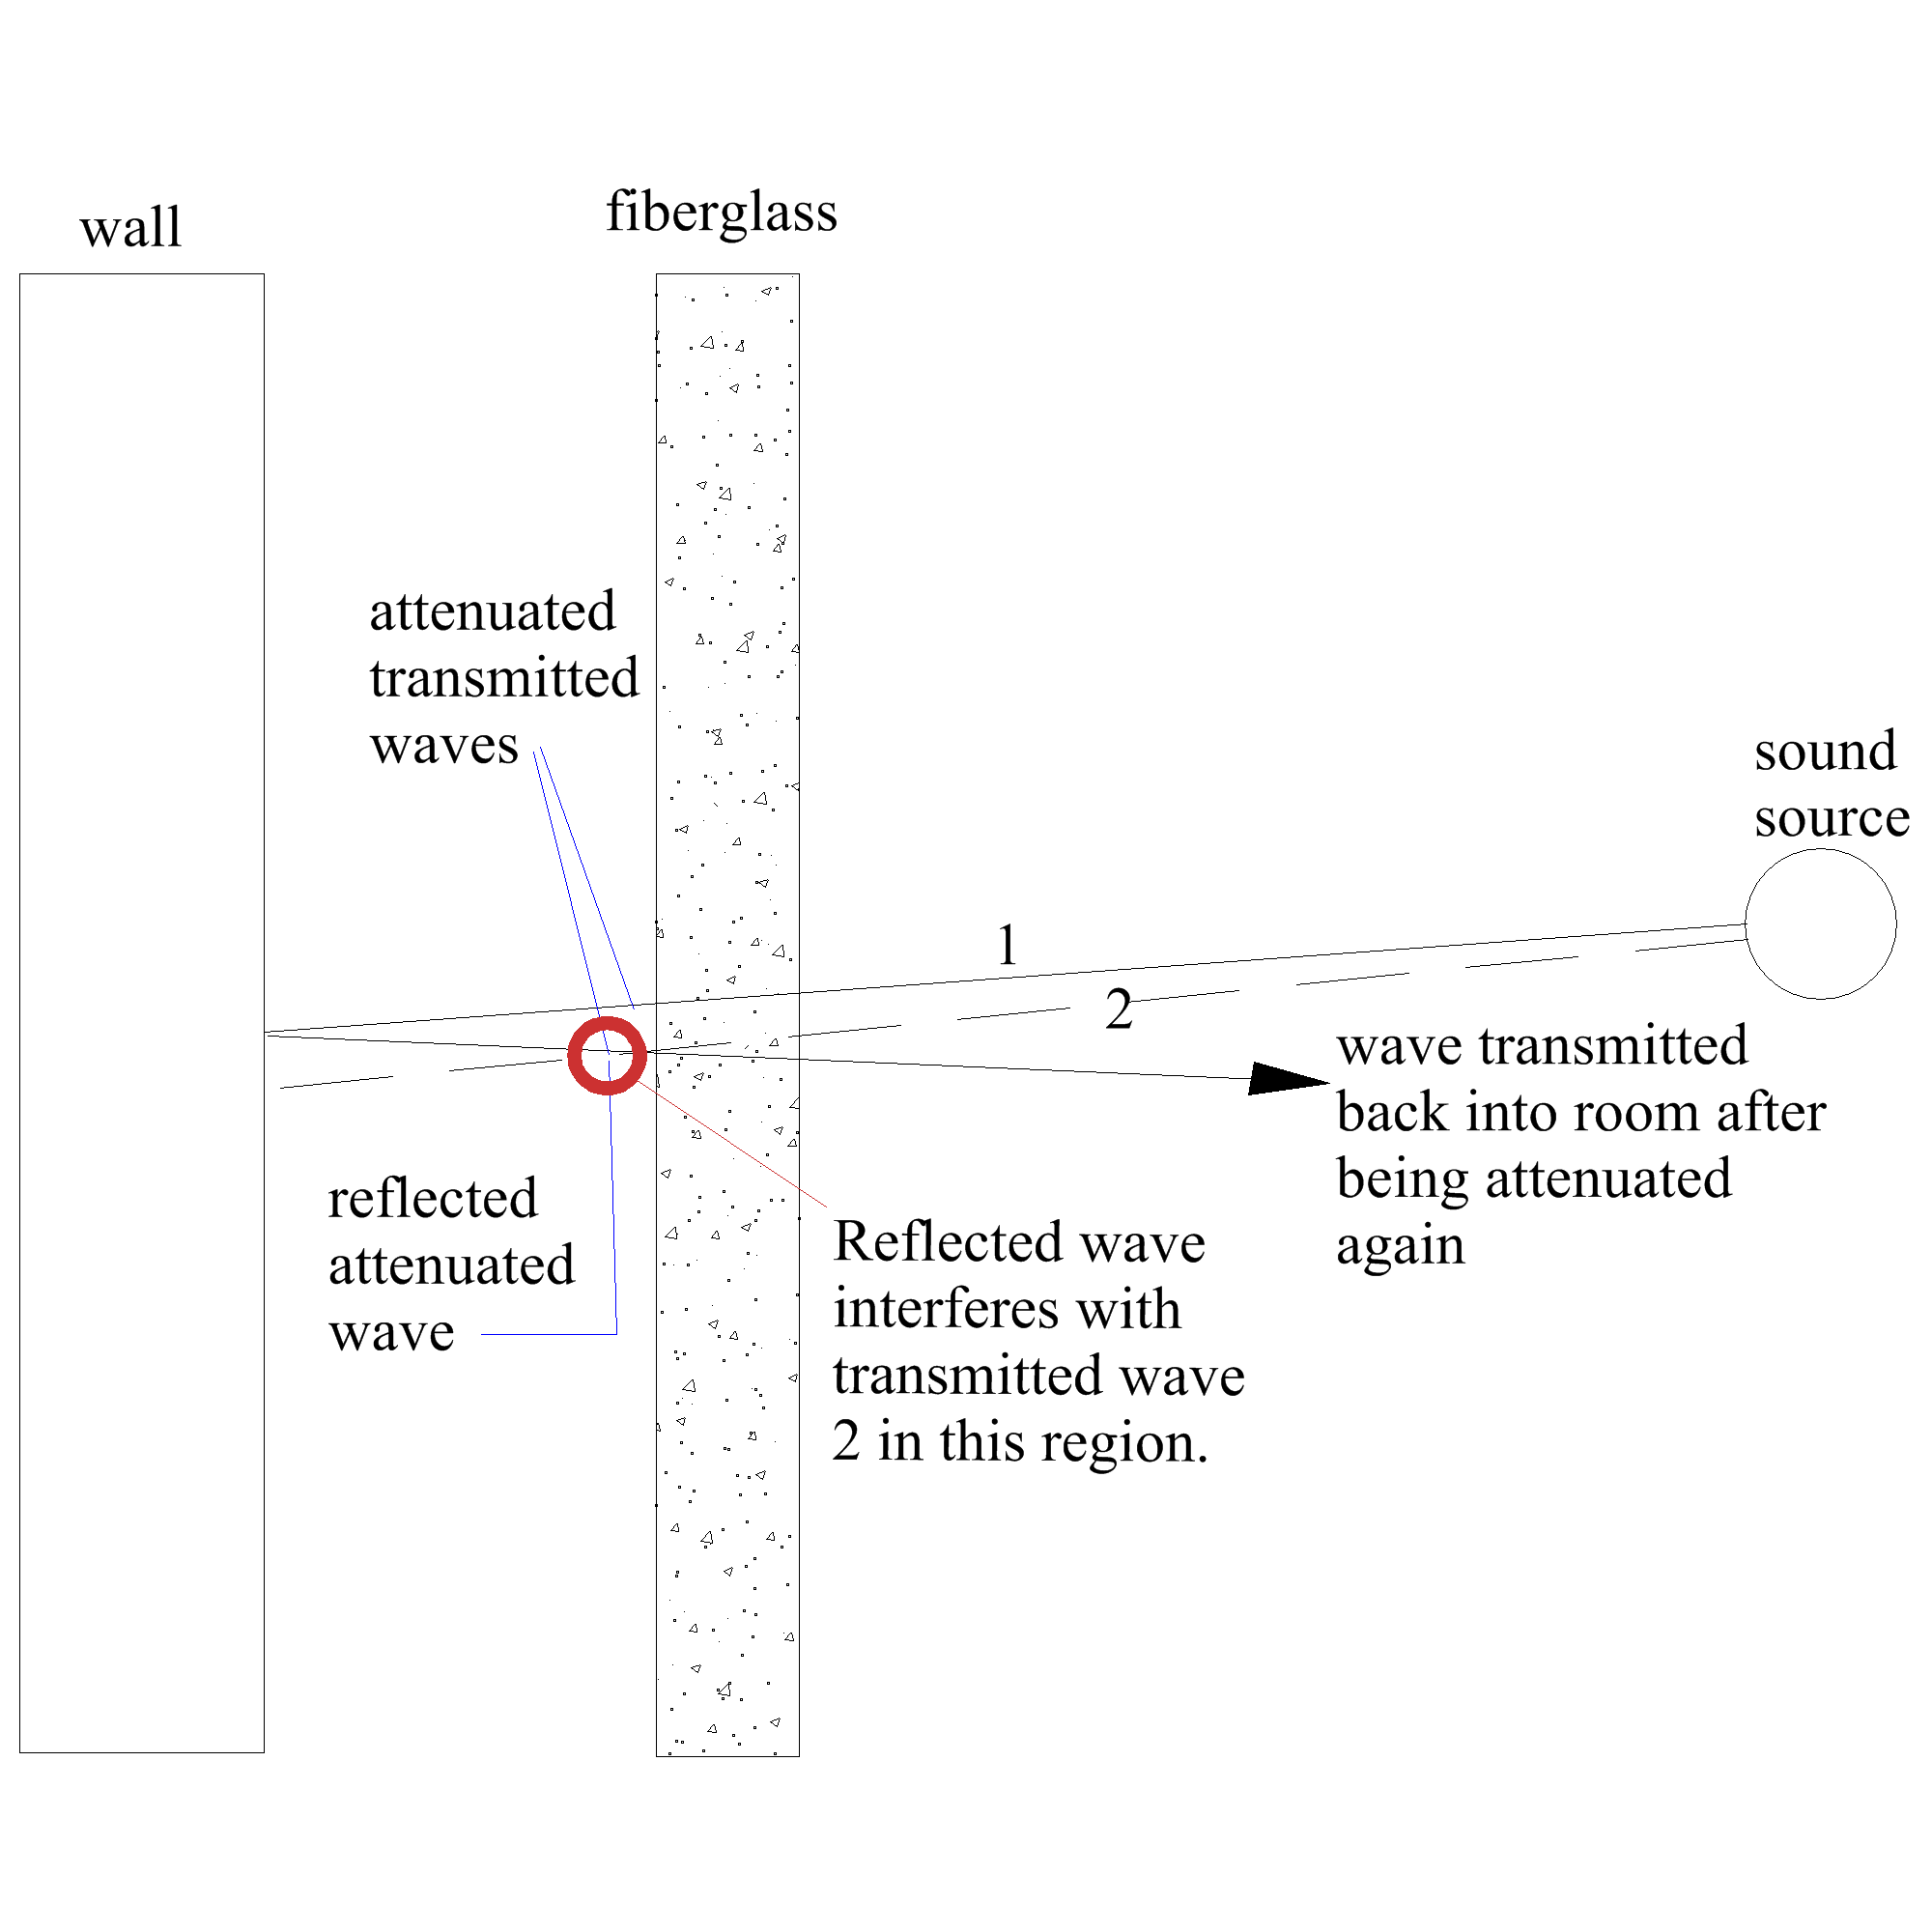
Figure 3: A sound wave passing through an absorber, then being reflected and passing through the absorber again
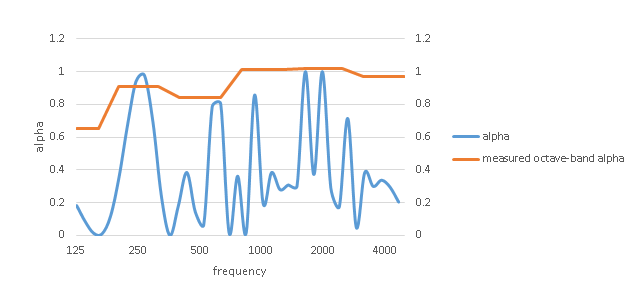
This attenuated wave proceeds to the rigid wall at left, then is reflected, experiencing a phase reversal when the reflection occurs. This reflected wave propagates back to the right, interfering constructively or destructively with the wave that has just passed through the fiberglass. The combined effects of this interference and the particle velocity in the original wave as it strikes the fiberglass cause the attenuation provided by the fiberglass to vary enormously with frequency. The blue curve in Figure 4 shows the frequency-dependent absorption coefficient of a 1”-thick fiberglass panel, mounted 400 mm from a rigid wall (“E-400 mounting”, commonly used for testing ceiling tiles). If the alpha were calculated in 1-Hz intervals and plotted against a linear rather than log frequency axis, the curve would exactly repeat itself at intervals. The orange line shows the measured octave-band alpha of 1” Armstrong Optima Open Plan acoustical ceiling tiles. Notice that the frequencies of very low alpha are hidden by the octave-band averaging. So in addition to the alpha at a particular frequency depending on the thickness of the absorptive material, as shown in Figure 2, it also depends upon spacing from a rigid wall.
Now what about the effect of the surface area of absorptive material? That will take a “whole ’another blog”! At least now we have a handle on how the thickness dimension of absorption — in relation to the wavelength of the sound — affects the absorption coefficient. Usually, in designing THX-grade cinemas, we use 4″ fiberglass on the rear wall to prevent reflections that would confuse the aural sense of direction of the surround channels.
 Richard A. Honeycutt developed an interest in acoustics and electronics while in elementary school. He assisted with film projection, PA system operation, and audio recording throughout middle and high school. He has been an active holder of the First Class Commercial FCC Radiotelephone license since 1969, and graduated with a BS in Physics from Wake Forest University in 1970, after serving as Student Engineer and Student Station Manager at 50-kW WFDD-FM. His career includes writing engineering and maintenance documents for the Bell Telephone System, operating a loudspeaker manufacture company, teaching Electronics Engineering Technology at the college level, designing and installing audio and video systems, and consulting in acoustics and audio/video design. He earned his Ph.D. in Electroacoustics from the Union Institute in 2004. He is known worldwide as a writer on electronics, acoustics, and philosophy. His two most recent books are Acoustics in Performance and The State of Hollow-State Audio, both published by Elektor.

