Line Array Realities
Line arrays are often stereotyped by how they behave at high frequencies. When full-range sound is considered, the reality is much different.
Source Types
A point source emits sound waves that are spherical in shape. The physicist’s theoretical point source produces a spherical wavefront at any distance from the source. When we move into the realm of physically realizable sources, the increased size and irregular shape produce a wavefront that is not spherical near the source at all frequencies. This is the near field of the source. As the waves continue to propagate, they eventually become spherical. This is the far field of the source.
A stone tossed into a pool of water provides a visualization of spherical waves. A board tossed into a pool of water provides a visualization of waves that are cylindrical near the source (the near field) that morph into spherical waves in the far field (Figure 1). The board is a crude example of a line array.

Figure 1 – The shape of the wavefront is distance-dependent for real-world sources. Propagating waves in a free field eventually become spherical.
Spherical waves attenuate at a rate of -6 dB-per-2x distance. This is the inverse-square law. Cylindrical waves attenuate at a rate of -3 dB-per-2x distance (Figure 2). An alternate description is that a point source attenuates with the inverse of distance-squared (1/r2) and a line source attenuates with the inverse of distance (1/r). The 1/r2 and 1/r descriptors are more compact.

Figure 2 – Attenuation vs. distance for ideal wave shapes.
All physically realizable sources have a near field and a far field. The larger the source, the larger its near field.
Loudspeaker Arrays
Closely spaced point sources can merge to form a new source. This “mutual coupling” can provide some benefits regarding SPL, efficiency, and directivity. The larger source has higher directivity, a longer near field, and its directivity extends to a lower frequency.
Loudspeaker system designers utilize this complex summation to produce directivity patterns that cannot be achieved using a discrete source. A new source is produced by the acoustical summation of the individual sources. The performance of an array must be considered:
- over an appropriate frequency range (e.g. 100 Hz – 10 kHz).
- at an appropriate frequency resolution (e.g. 1/1-oct or 1/3-oct).
- out to an appropriate distance (e.g. 100 m).
Computer simulation is the most practical approach for array analysis. I will use CATT-Acoustic™ to present the behavior of line arrays.
Line Arrays
A line of point sources can be tight packed to form a line array. How tight? The general guideline is a maximum separation of 1/2-wavelength at the highest frequency of interest (Figure 3). Small sources allow closer spacing, better emulating a continuous source to a higher frequency. Low frequency line arrays are easily formed by stacking boxes. Some serious engineering is required to achieve the required spacing at high frequencies.

The quest for the continuous sound source continues. All discrete line arrays have a high frequency limit based on the source spacing, above which the sources act individually. This produces lobes in the radiation pattern. Of course, as with all things acoustic this “break frequency” is a gradient, the center of a region of transition.
Figure 4 provides the frequency and wavelength information needed to consider line array behavior. Of greatest interest are the speech intelligibility bandwidth limits, the 1/1-oct transition frequencies, and the wavelengths that determine the source spacing.

Figure 4 – Bandwidth/wavelength chart useful for line array investigations
A Spacing Example
I’ll make the spacing 0.082 m (3.2 inches). This is approaching the highest possible density with 3-inch transducers, which is (arguably) the smallest practical source diameter for speech range operation. Figure 5 shows the vertical far field polars of a 1 m (12-element) array. Note the side lobes produced by the spacing of discrete elements above the break frequency. Halving the element spacing would push the break frequency up one octave. Doubling the element spacing would lower it by one octave. 3-inches is a practical compromise for element spacing.

Figure 5 – The far field polars of a 1 m discrete element array. Note the array orientation (shown on the 125 Hz polar). (CATT-A)
Continuous Lines
Next, I’ll simulate the performance of a continuous line array. This is done by reducing the spacing to that required to meet the 1/2-wavelength criteria at 20 kHz. This makes it continuous for the entire audible frequency range. Figure 6 shows the far field polars. Note the absence of the “side lobes” produced by a discrete array.

Figure 6 – The far field polars of a continuous 1 m array. Note the absence of side lobes. (CATT-A)
An Ideal Reference
In acoustics it can be beneficial to use ideal, theoretical examples to establish a reference case for understanding real-world behaviors. For the remainder of this article, I will use continuous arrays of fixed length as shown in Figure 7. This eliminates the side lobes produced by discrete element spacing.

Figure 7 – A comparison of line arrays based on length. The maximum near field full-range working distance (>300 Hz) is shown at the bottom.
Near vs. Far Field
Due to its length, there is a near field and a far field. The transition distance between the two is determined by the array length. The near-to-far field transition increases with the array length. If the goal is to place the listeners in the near field, a long array is required. How long?
Most “line array formulas” determine the near-to-far field transition distance for the highest frequency of interest. That’s what we need if our intent is to measure a far field polar for the entire bandwidth of the array. Unfortunately, that’s the wrong answer if the intent is to place the listener in the near field for a lower frequency. If the objective for using a line array is to have cylindrical radiation, you want cylindrical radiation at all frequencies. This becomes increasingly difficult with decreasing frequency. The near-to-far field transition frequency must be reduced to some low frequency limit. A conservative goal is the lower boundary of the speech range needed for communication, which is arguably 300 Hz.
For example, the near-to-far field transition distance for an 8 m line array is about 600 m (200 ft) at 10 kHz. This means that beyond 600 m the sound waves are spherical and attenuate at 1/r2 for all frequencies below 10 kHz and 1/r for frequencies above 10 kHz. Figure 8 shows the IR and frequency response magnitude for the 8 m array.

Figure 8 – The impulse response and frequency response magnitude of the 8 m array at 630 m. The near field is very long above 10 kHz. Full-range far field measurements must be made beyond this distance. (CATT-A)
“A” gives the near/far transition distance for 20 kHz. “B” is set for the distance that lowers the transition frequency to 10 kHz. This is shown by “C” on the frequency response magnitude. The waves are spherical out to 630 m for frequencies below 10 kHz. The waves are cylindrical beyond 630 m for frequencies above 10 kHz.
But the objective is to place the listener in the near field (where the waves are cylindrical) down to 300 Hz. This will require a much taller array or a much closer listener distance. Assuming that we are stuck with the 8 m array height, the only solution is to move closer to it.
Each halving of the listener distance “B” will lower the near/far transition frequency by one octave. The trend is as follows.
630 m/10 kHz, 315 m/5 kHz, 157 m/2.5 kHz, 79 m/1.25 kHz, 40 m/625 Hz, 20 m/≈300 Hz.
This is bad news for cylindrical sound waves. The maximum working distance from the 8 m array is about 20 m if the cylindrical wavefront (1/r attenuation) is maintained down to 300 Hz.
Those who market line arrays like the larger (600 m/10 kHz) distance. Those who measure line arrays must use the larger distance if far field data is to be collected. Unfortunately, the lower number (20 m/300 Hz) is the reality. We want our cylindrical waves through the entire speech range, not just at the upper edge of the pass band.
Figure 9 shows the IR and Frequency response magnitude at the 20 m distance. Inside of 20 m the listener is in the near field down to 300 Hz.

Figure 9 – The listener distance (B) has been reduced to the lower boundary of the 500 Hz octave band (C). The listener must be inside of 20 m to be in the full-range far field. (CATT-A)
Figure 10 shows the vertical radiation out to 100 m for a continuous array with a length of 8 m (25 ft). The near field extends to 25 m for the 500 Hz octave band, doubling for each successively higher octave. This puts it at about 600 m at 10 kHz, well beyond the 100 m maximum shown on the plot. The 8 kHz radiation is where those perfect, cylindrical descriptions of line array radiation come from.
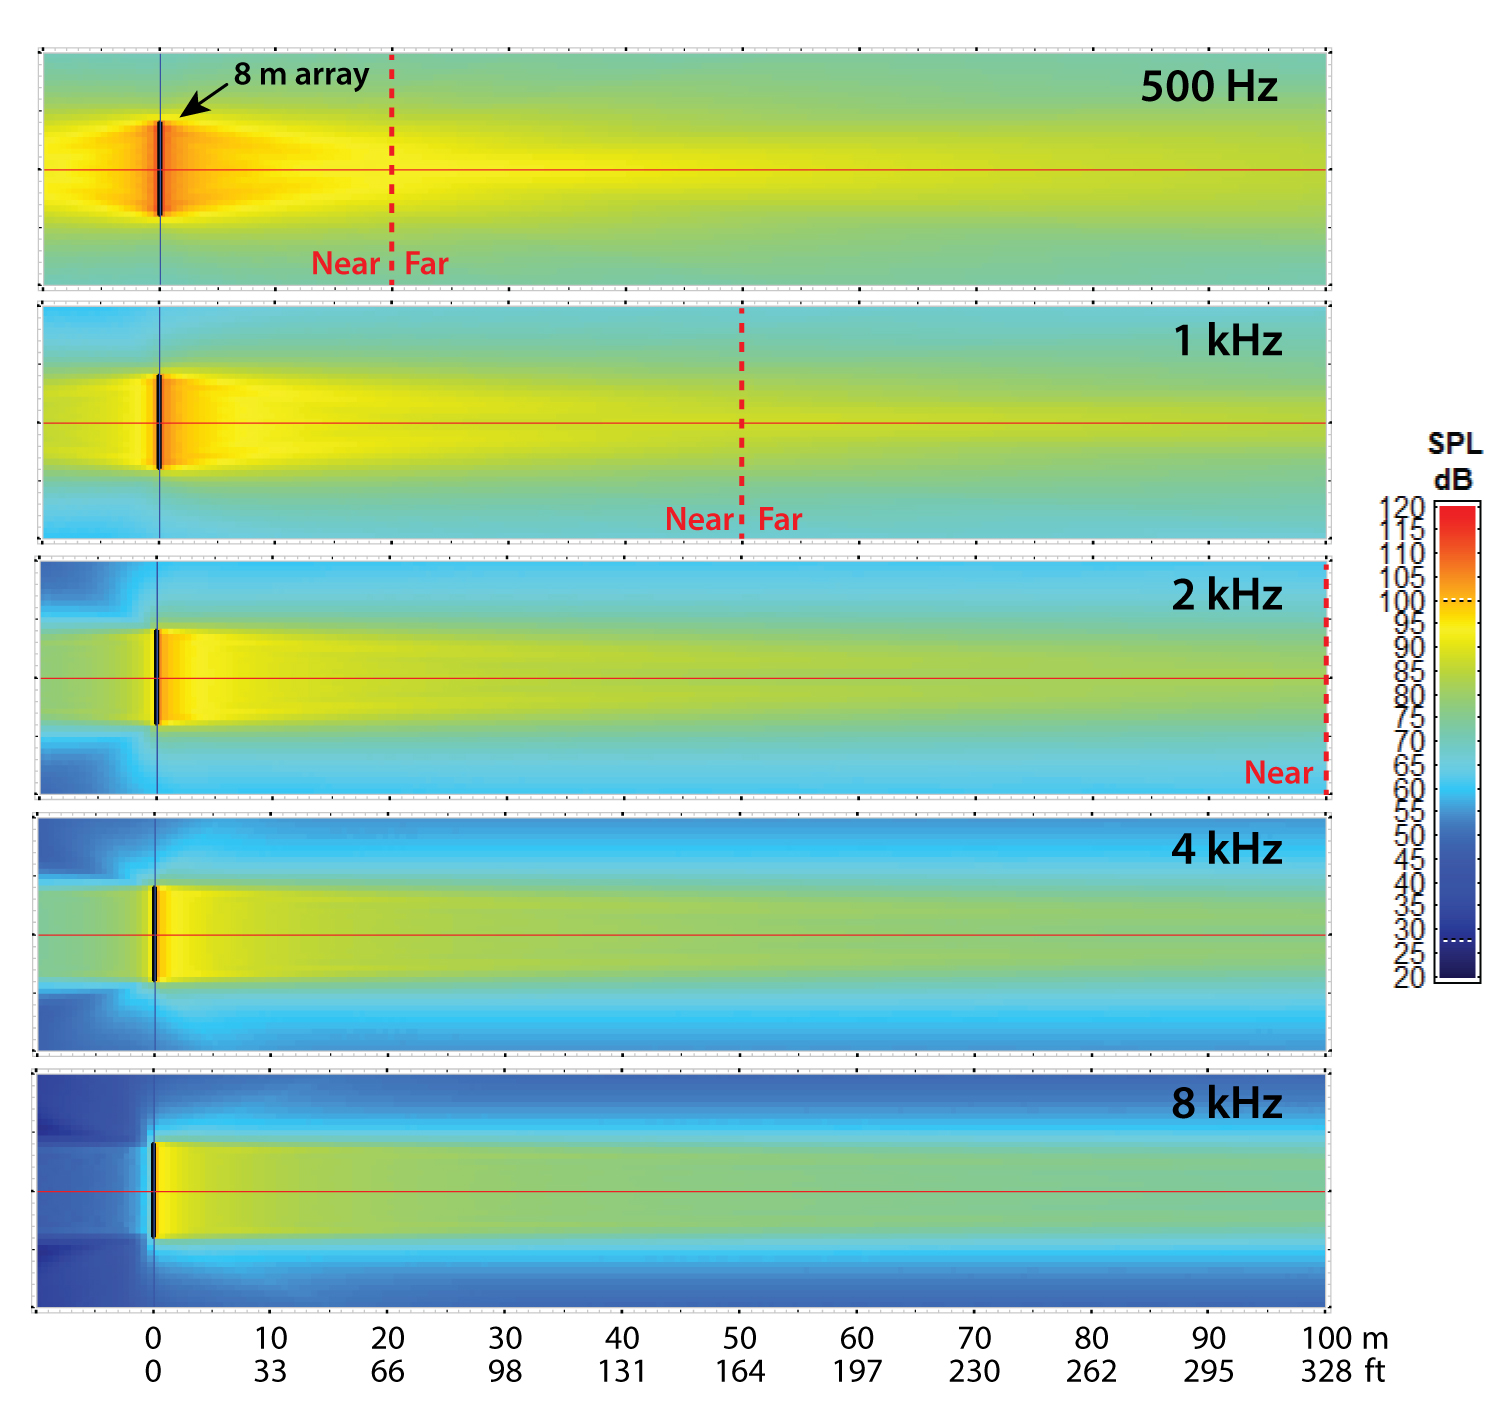
Figure 10 – Vertical slice map of 8 m array out to 100 m. The near/far divider for the 500 Hz octave band establishes the maximum near field distance for the speech range (~20 m). (CATT-A)
The frequency response magnitude at 20 m is shown in Figure 11. The near field response (to the right of the far/near divider) is of interest. Here are a few observations:
- The response can/should be equalized. At least two min phase filters are needed (Figure 11). When equalizing in the near field I would suggest averaging the response at 20 m, 10 m, and 5 m if listeners are present at those distances.
- The comb filtering (ripple) in the far field response is caused by the abrupt change in the acoustic impedance at the ends of the array. The comb filter pattern is distance-dependent and cannot be equalized. This “end effect” is innocuous – barely visible at 1/3-oct smoothing. If it bothers you it can be mitigated by level tapering the elements at the array ends.
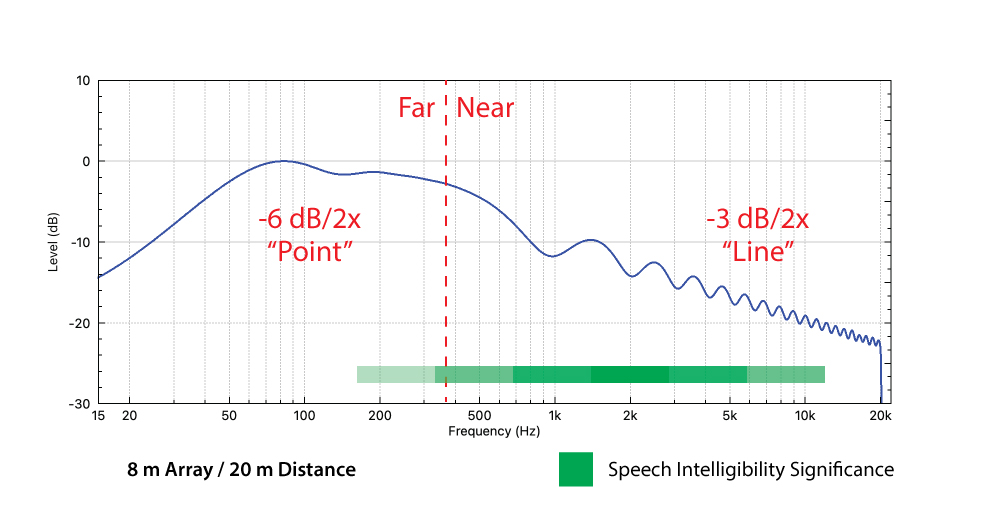
Figure 11 – The frequency response magnitude at 20 m. (FIR Designer M)
 Figure 12 – Line arrays need equalization. (FIR Designer M)
A very tall array is required to keep the audience in the near field for the full speech range to a distance consistent with most auditoriums. Contrary to popular belief, most line arrays do not operate on this “near field” principle. Since line arrays in many forms exist, I will refer to this one as a near field line array.
As such, line array design involves a set of trade-offs and some philosophy. If your line array philosophy is to place the audience in the near field, you need a very tall array. If your line array philosophy is to place the audience in the far field, you want a much shorter array. There are pros and cons to each approach.
Scaling the Line Array
The 8 m array establishes a reference case for considering the behaviors of shorter arrays. A shorter array will have a shorter working distance than the 8 m array for 1/r attenuation. Since we now know that the wavefronts from a line array are cylindrical up close (the near field) and become spherical with increasing distance (the far field) we can pose the question “What is the maximum distance I can be from a line array of given height and be in the near field?” Using the 8 m array as an example, I have shown how the maximum listener distance is established by the low frequency criteria.
I used the same process to determine the working limits for the shorter arrays. These values are shown in Figure 7 in the grey boxes.
As you can see, the limiting distance for cylindrical waves drops dramatically with the array height. A four meter array only gets us to 6 m (≈20 ft). That represents a practical limit for the “place the audience in the near field” design philosophy. Shorter arrays simply don’t reach far enough to achieve this behavior for the range need for optimal speech intelligibility.
Far Field Line Array
An alternate design philosophy is to shorten the array to shrink the near field so that the listeners are in the far field. The array behaves as a point source (1/r2 attenuation) but it still has some valuable attributes. The interference between the elements produces a narrow, elliptical radiation pattern – much narrower than can be achieved by horn loading.
Figure 13 shows the vertical radiation maps for a 1 m array. Compared to the 8 m array, it lacks the “muscle” needed for full range vertical pattern control.
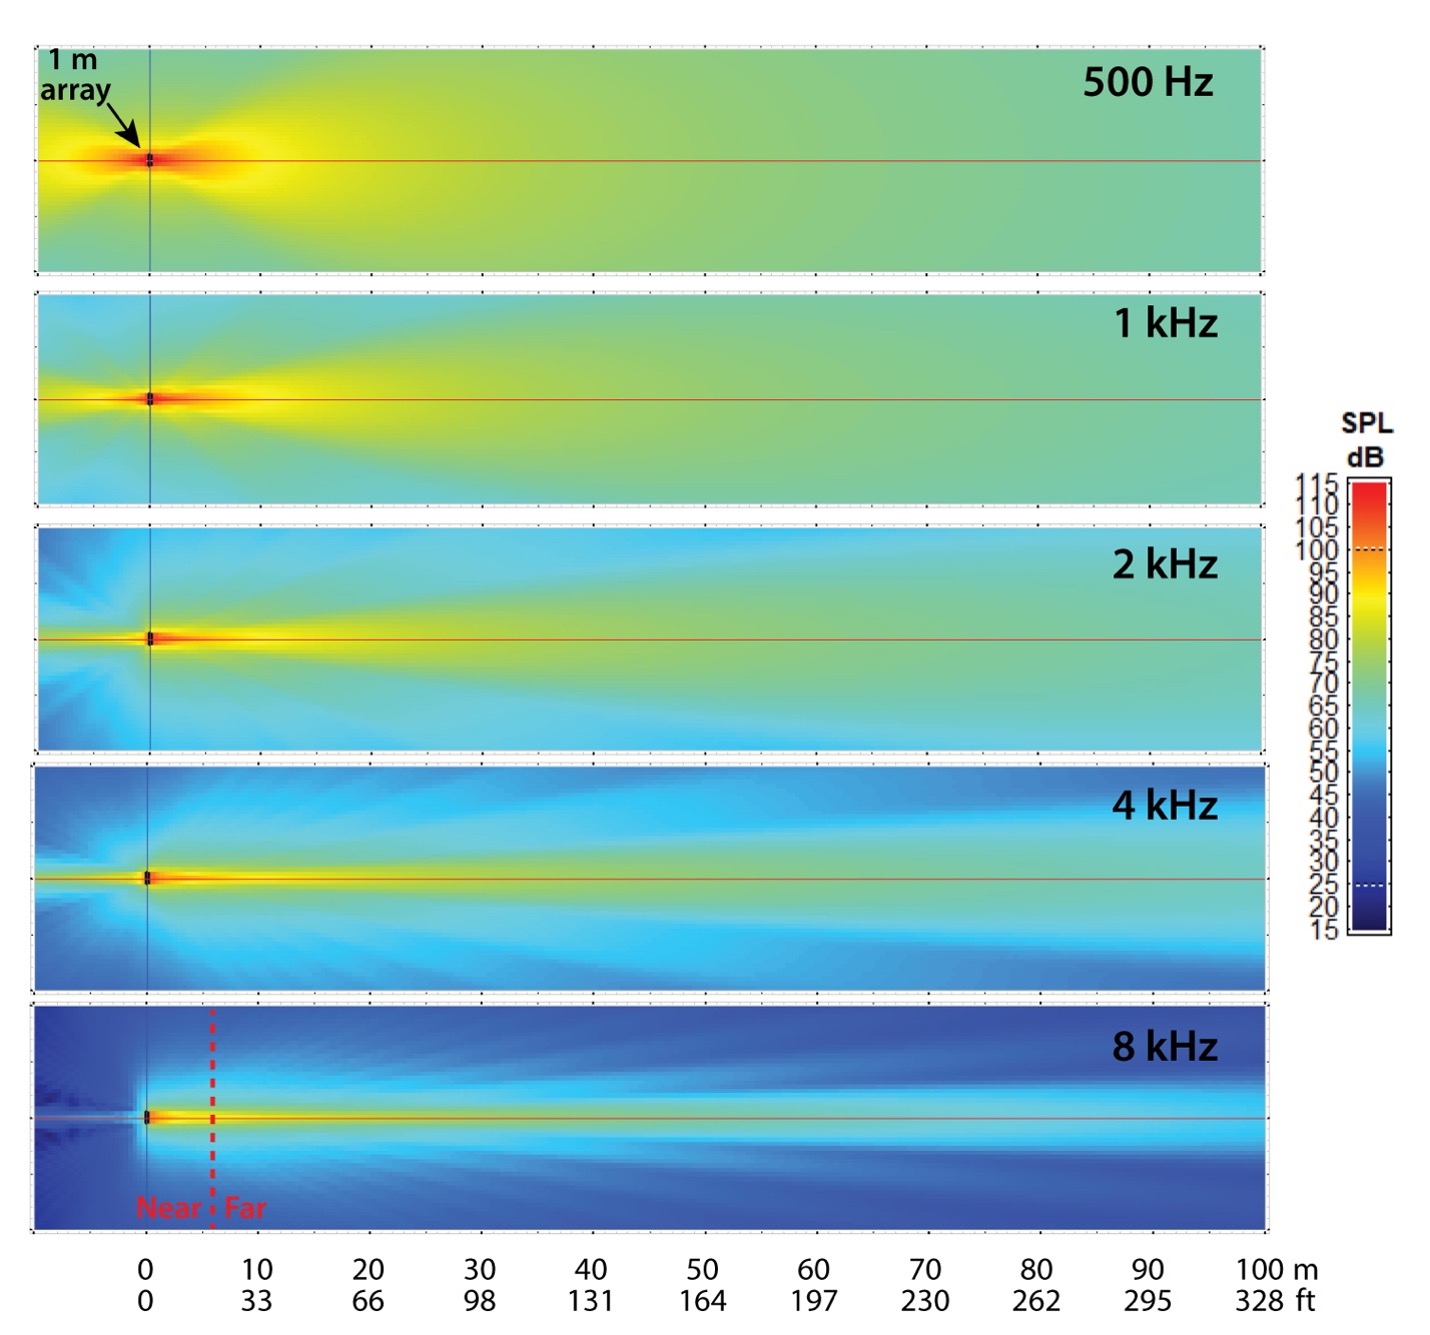
Figure 13 – Vertical slice map of the 1 m array, out to 100 m. The near field is very short, extending to about 8 m in the 8 kHz octave band. Most listeners will be in the far field of this array for the speech range. (CATT-A)
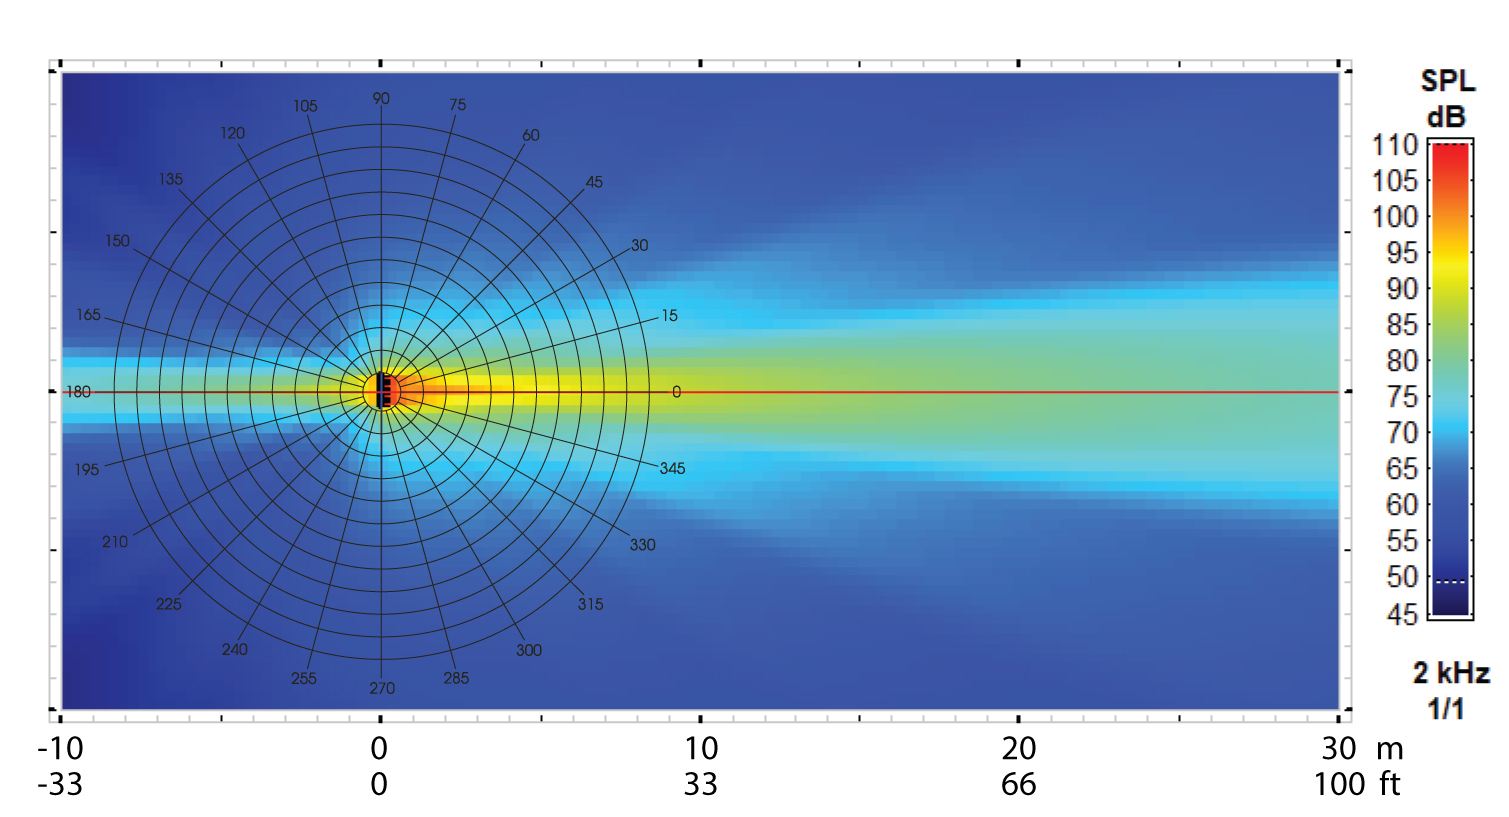
Figure 14 – The vertical coverage angle at 2 kHz is a small fraction of a sphere, only a few degrees. Even though this is a “line array” the waves become spherical a short distance from the array. (CATT-A)
Placement and Aiming
Figure 15 shows the vertical map and audience plane map for the 1 m array. The array is centered at ear height and perpendicular to the floor. The SPL attenuates at 1/r2 over the audience plane (-6dB/2x distance). This is how any point source would perform. The only benefit from using a line array is the confinement of sound energy to the listener plane (reduction of vertical radiation). While this “works” it’s not the best way to deploy a 1 m array for most applications.
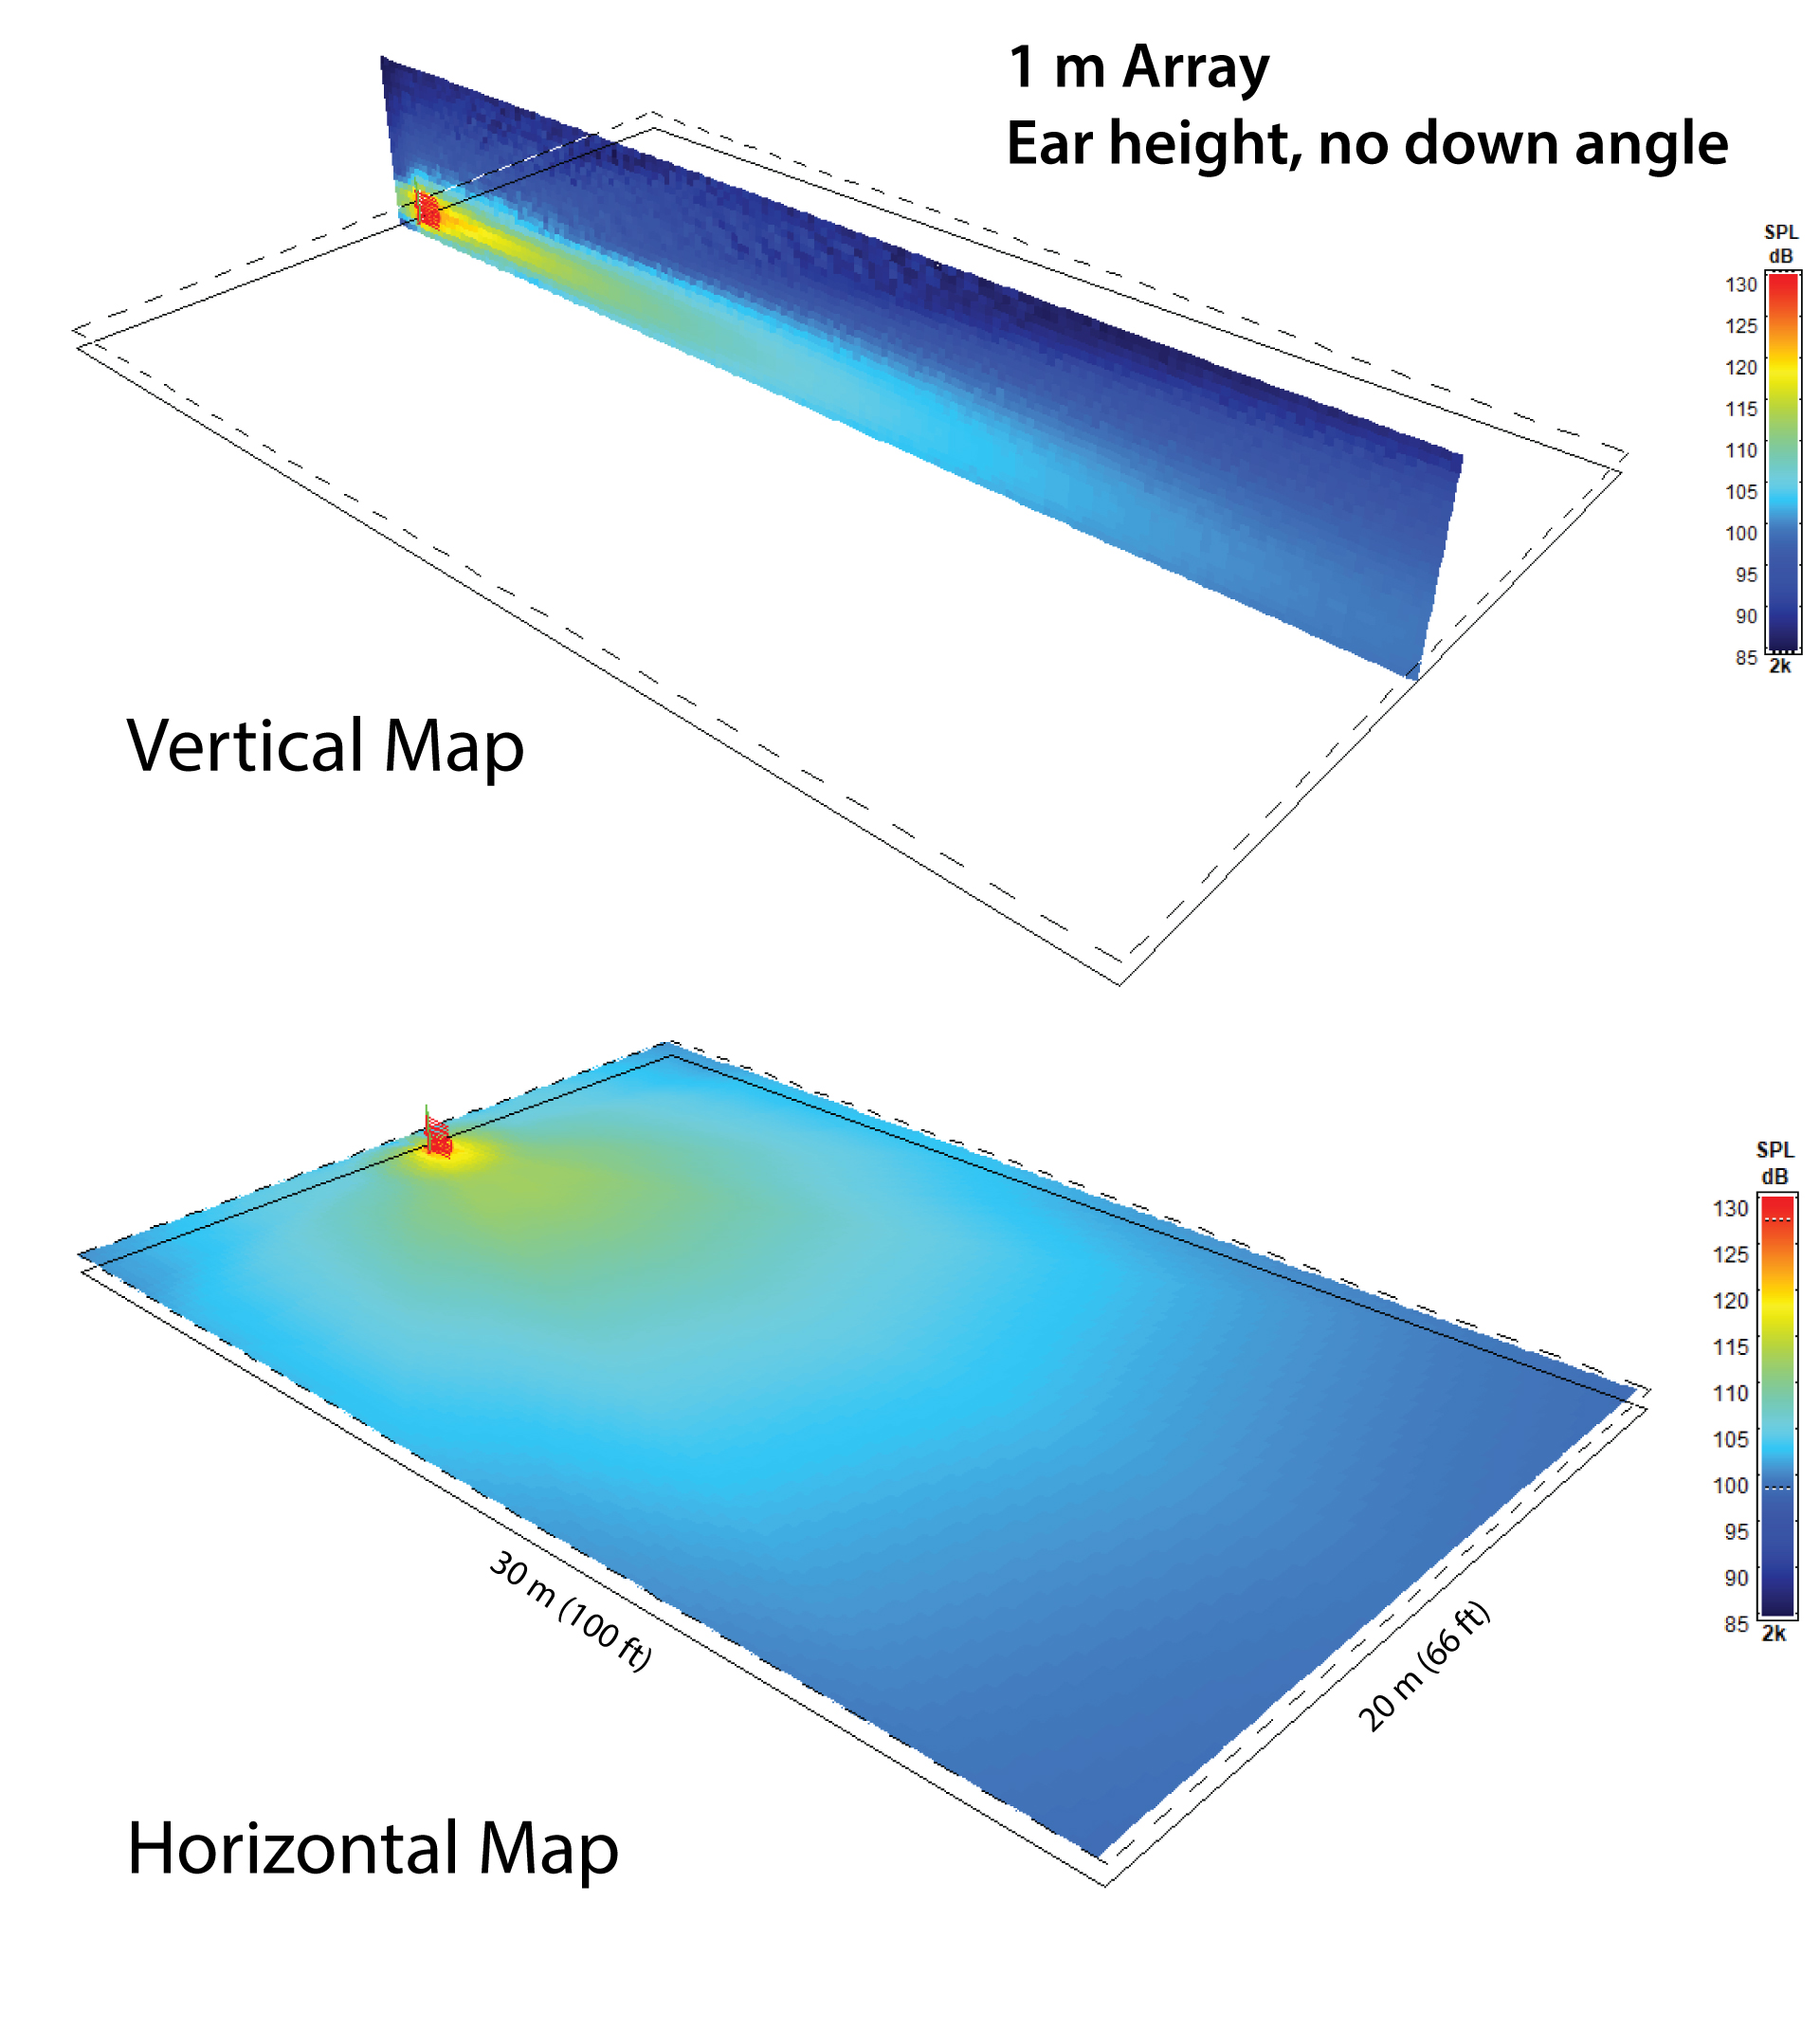 Figure 15 – Coverage of a 1 m array, mounted at ear height. This is for the 2 kHz octave band. (CATT-A)
Rather than place listeners normal to the array as with the near field line, the shorter array can be elevated and tilted to place the furthest listeners on-axis (Figure 16). From this position, as one moves toward the array the SPL increases due to the shorter distance but decreases since we are moving off-axis to the array. These two effects can offset each other, producing even coverage of the audience plane. So, the coverage of this array has nothing to do with cylindrical wavefronts and everything to do with spherical wavefronts, a tight pattern, and clever aiming. The coverage is much more even than that produced by the 8 m array.
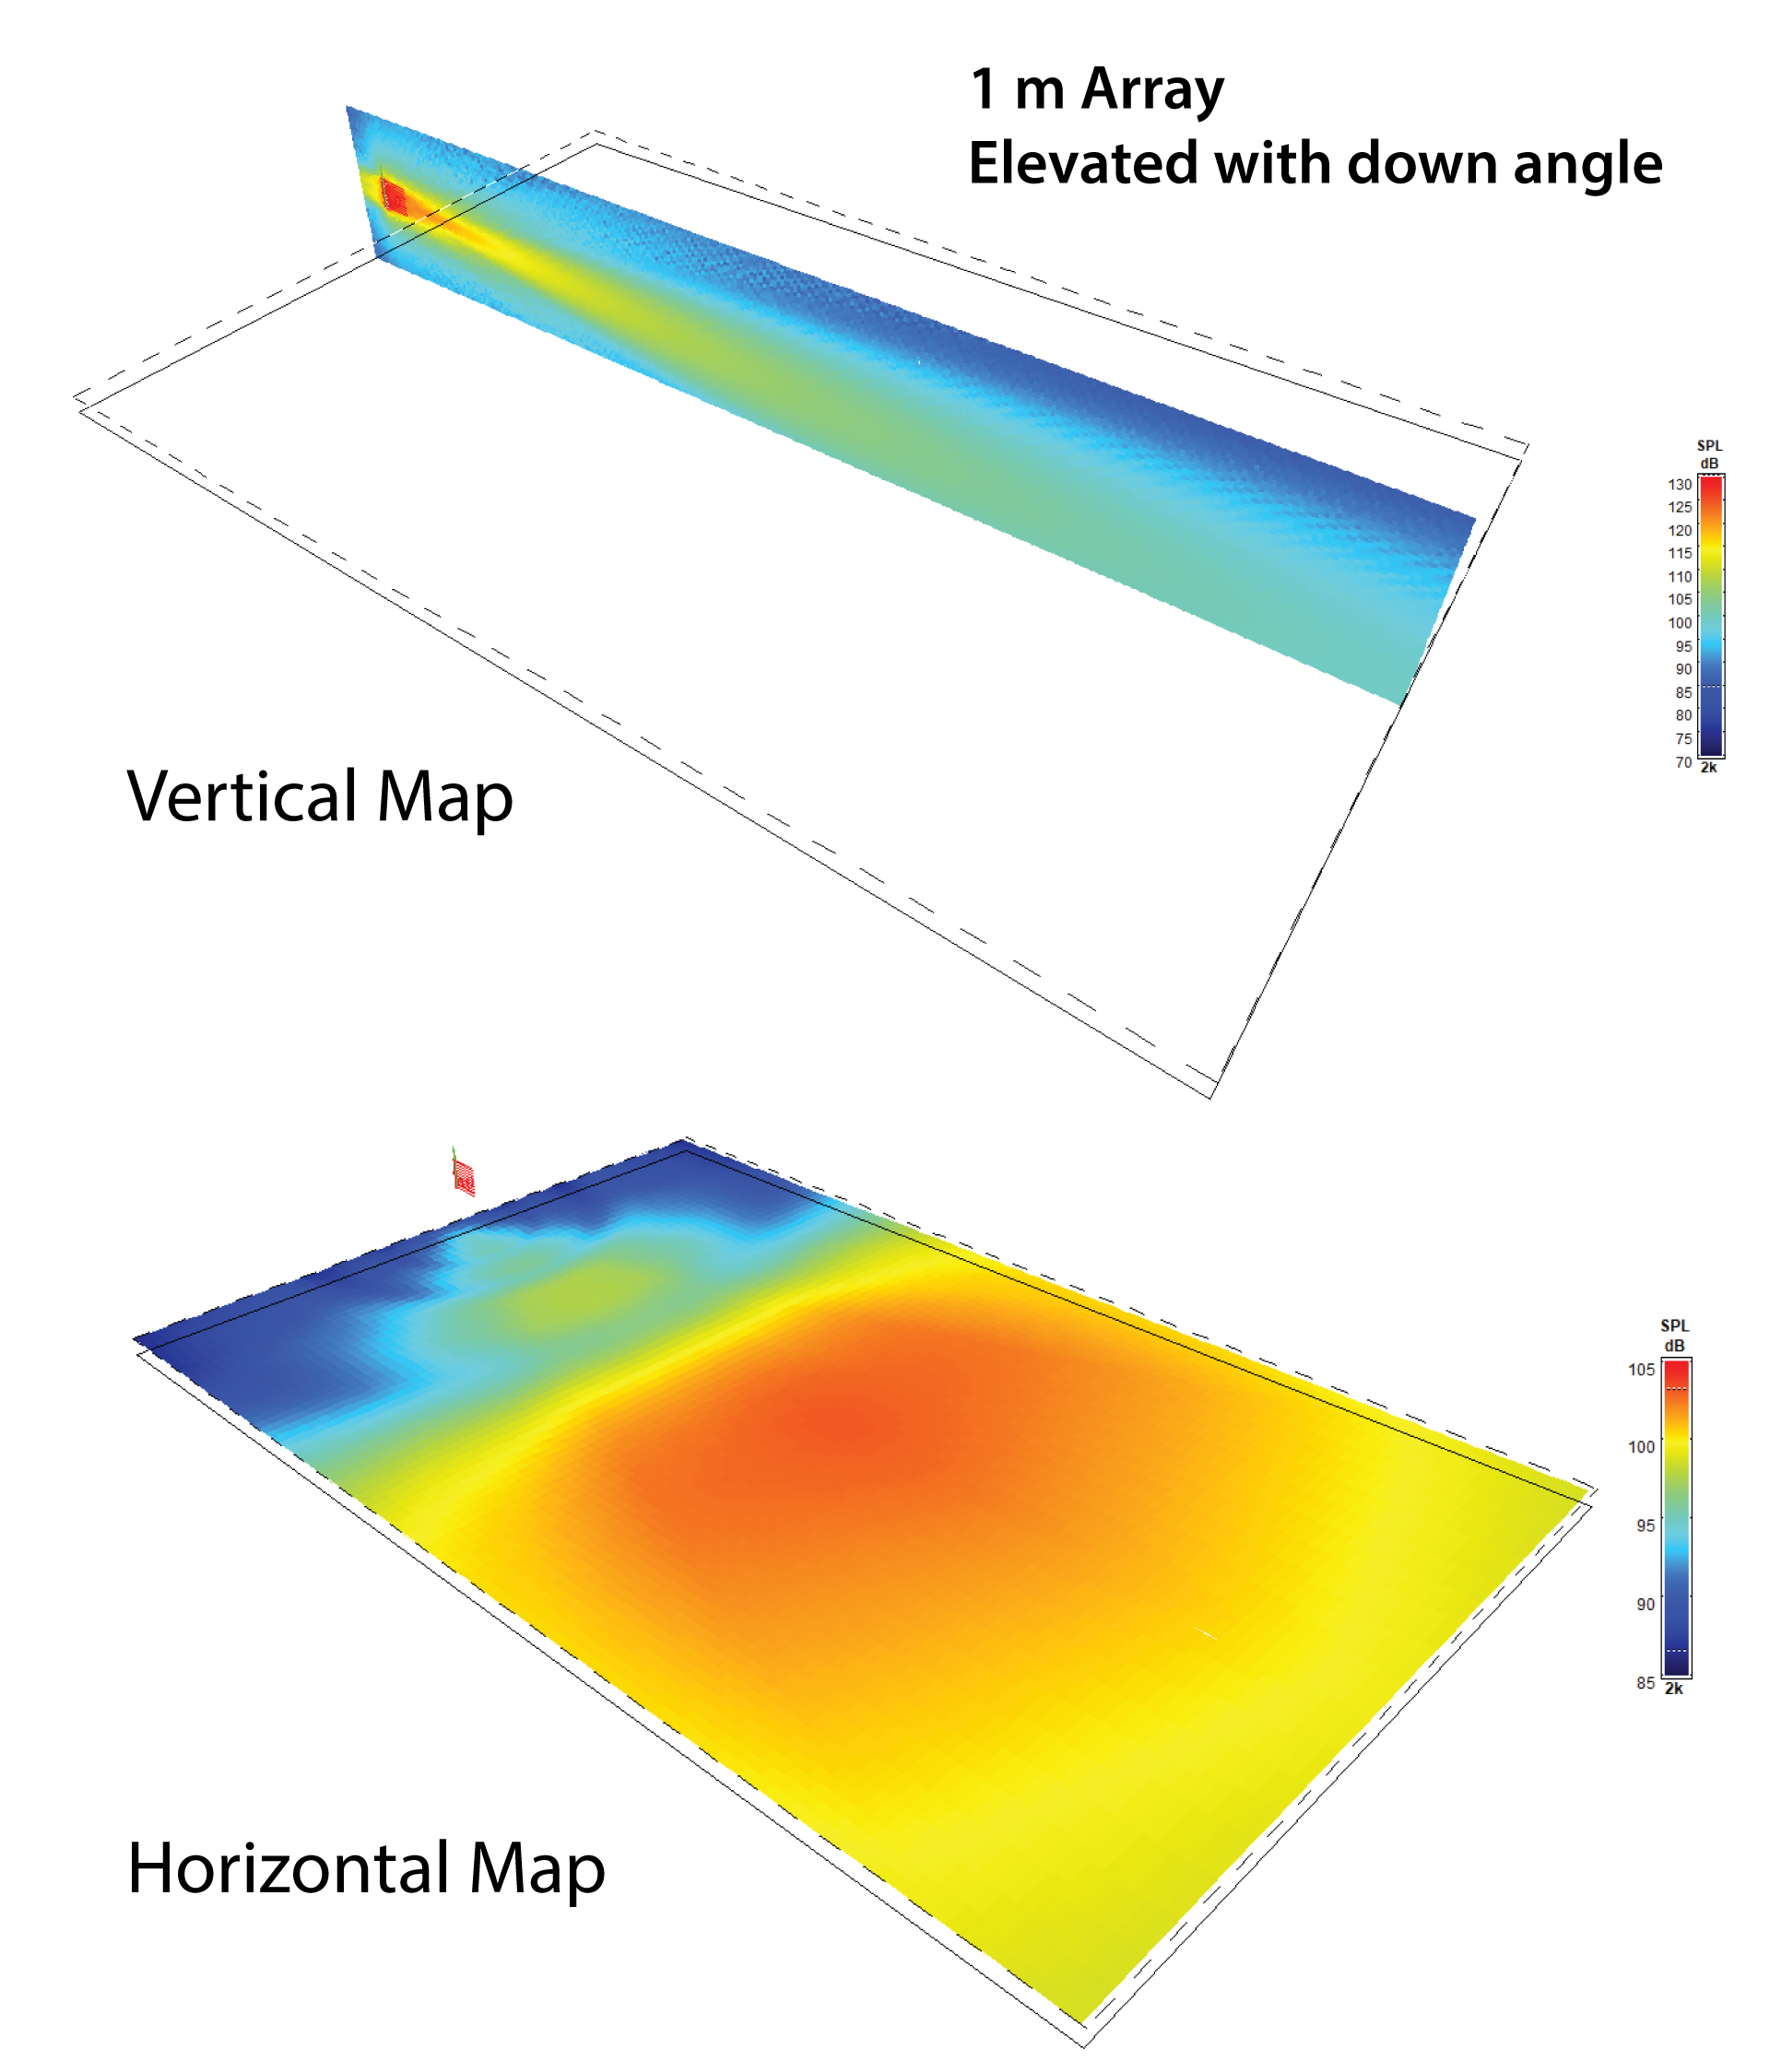
Figure 16 – Elevating the the array and aiming at the farthest listener produces a very even audience plane coverage. (CATT-A)
One meter in height is a sort of “sweet spot” for a far field line array. It’s long enough to produce pattern control through the speech range, and short enough to place the listeners in the far field for the bulk of the speech range.
Variations on the Theme
There are many more line array types and implementations than I have shown here. Variants of straight columns include:
– Stacked arrays
– Ground-plane placement
– Frequency-shaded arrays
– Level-tapered arrays
– Beam-steered arrays (active and passive)
– Constant-Beamwidth Transducer (CBT) arrays
Clever sound system designers utilize these techniques to sculpt the radiation pattern needed for optimum audience coverage. Line arrays are versatile devices, indeed.
Conclusion
I’ve shown that a “textbook” line array must be very tall to place the audience in the near field for the speech communication range. It produces cylindrical waves at all frequencies, and 1/r attenuation vs. distance since the listeners are in the near field. I’ve dubbed this the “near field line array.” Most line arrays are assumed to have these attributes, regardless of length, frequency, or listener distance.
Most commercial line arrays are not nearly long enough to behave this way. They are essentially point sources with very narrow vertical coverage for wavelengths that are short relative to the array length. The bulk of the listeners are likely to be in the far field. I’ve dubbed this the “far field line array.” The behavior and deployment of this array is very different from a near field line array.
The near field array is a very specialized device. It is not beneficial (or practical) for many applications. The far field array is a general purpose tool, and when deployed properly it is one of the most useful tools in the system designers tool bag. pb
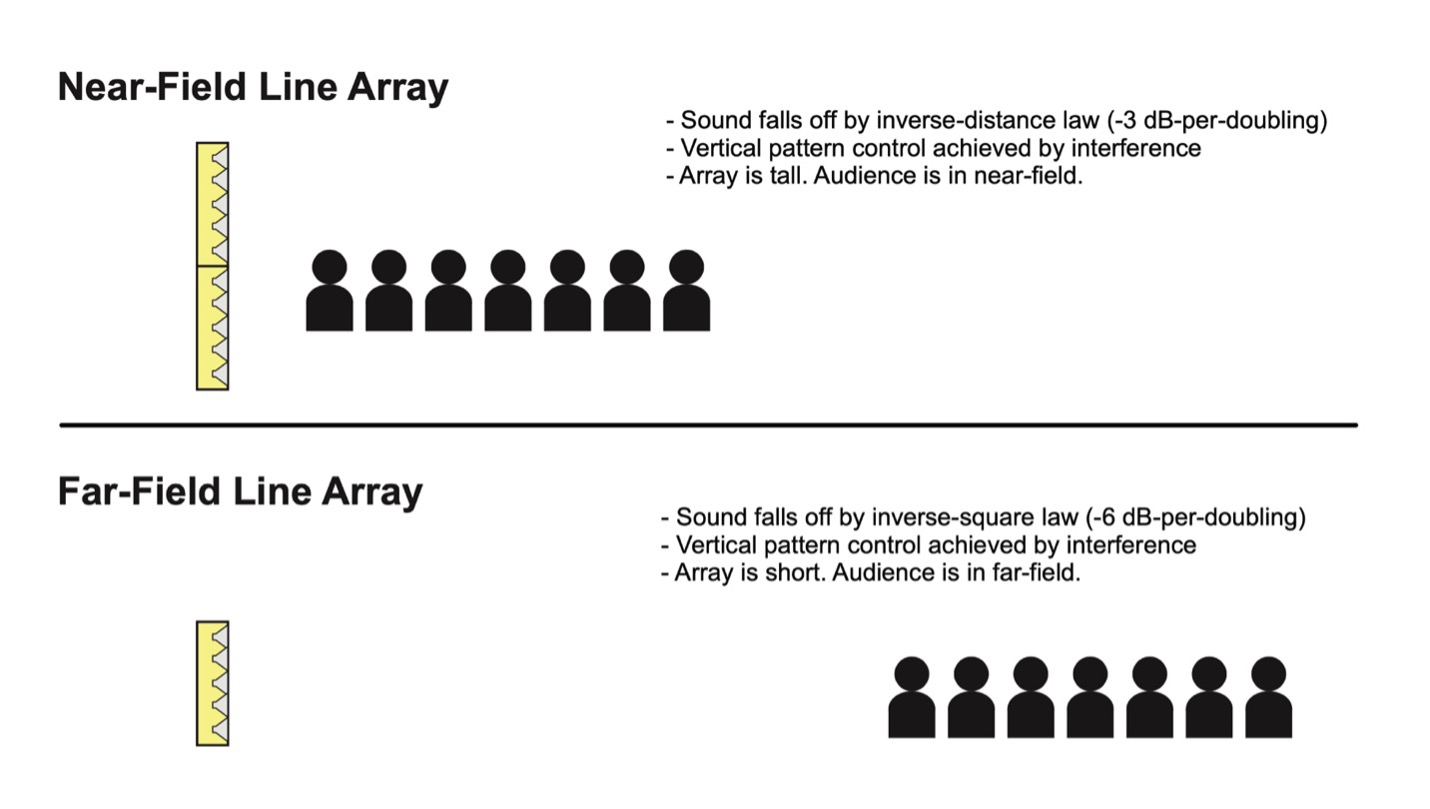
Figure 17 – Near and far field line arrays contrasted.
