Gain Structure Made Easy

Download a test waveform that will help you quickly set the gain structure of your system.
This is an updated version of a previous article. After using the meter test file for a few years, I was inspired to produce another version that cuts right to the chase and allows you to both evaluate your meter type and establish an optimal system gain structure.
The new version consists of a 400 Hz sine at -20 dBFS, with an embedded sine burst at 0 dBFS (two-second duty cycle). This allows you set the gain structure of a device by establishing either the nominal or maximum playback level. Clipping can be determined from the burst, either by clip light, oscilloscope, or piezo tweeter. Nice!
The following short video shows how to use the WAV file to setup a small mixer. The file is loaded onto an NTI MRPro for playback. Remember that the piezo cannot reproduce the 400 Hz tone, only the harmonics that result from clipping. If your audio device has a VU meter, use the -20 dBFS tone to set the level. If it has a peak meter, use the 0 dBFS burst. If you are not sure, use the piezo to find the clipping point of the device.
Download the Meter Test File (WAV format)
Original article follows:
A comprehensive treatise on audio meters could fill a bookshelf. This certainly isn’t an attempt at that. While there is much to know about any audio meter, the parameter that goes to the top of my list is ballistics. Is the meter showing me the peak level, loudness level, or something in between?
Since it can be a small research project to figure this out, I created a test waveform for quick meter evaluation. Just play it through the audio device and see how the meter responds. With this track you can quickly differentiate between VU, PPM and dBFS meters.
The Details
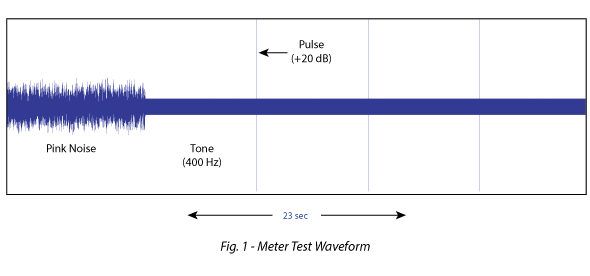
The waveform is shown in Figure 1 and includes 3 segments:
- 1. Pink Noise
- 2. A 400 Hz sine wave (tone)
- 3. The tone with an embedded +20 dB pulse (broadband)
The pink noise and tone are the same RMS level. The peak-to-RMS ratio (crest factor) is about10 dB. The pulses nested in the tone and are +20 dB relative to the steady-state level. They are spaced to allow any meter to fully decay to the level of the tone between the pulses, which are full scale.
Meter Types
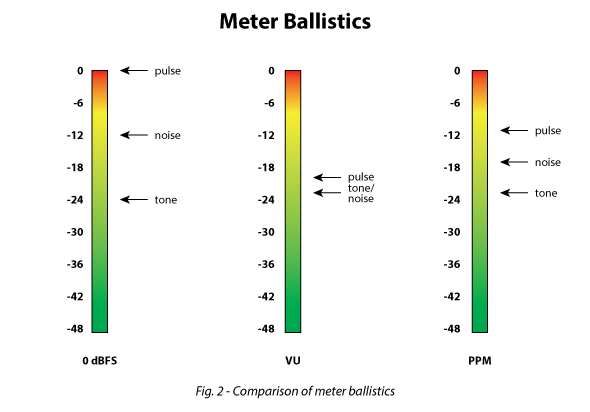
Figure 2 shows how some popular meter types will display this waveform. Please note that the vertical scale is in relative dB, and may be re-scaled depending on the meter type. Just pretend that you are working with a digital mixer that has selectable ballistics, but always uses the same vertical scale. This is becoming increasingly popular. Since what we are interested in are relative levels, the actual numbers are of secondary importance.
Here’s the big picture on what each meter displays:
- 1. Meter 1 (left) – A true peak (0 dBFS) meter as might be found on a digital signal processor or software wave editor. Its instantaneous response allows the true peak level of each segment to be displayed. DBFS means “dB full-scale” where full-scale is the highest amplitude that the device can pass. This meter is “loudness blind” and is basically a glorified clip light.
- 2. Meter 2 (center) – This Volume Indicator (VI), more commonly called a “VU meter” tracks the loudness value of the waveform, which tends to track the RMS level of the waveform. Since the noise and tone on the test track have the same RMS level, there is little difference in how they are displayed. It is practically blind to the pulse due to its necessarily slow response time.
- 3. Meter 3 (right) – The peak program meter (PPM) is a quasi-peak meter. It is not fast enough to show the true peak level, but it is faster than the VU ballistic. This makes it blind to both the loudness level and the true peak levels. It is used to monitor peak levels in a “human” way, being insensitive to the true levels of very short-term peaks. This “hybrid” meter may be the most common type found on modern gear.
When evaluating the metering on an audio product, I feed it this waveform and see how it responds. Be sure to turn down the amplifiers to avoid loudspeaker damage.
Characterizing a Meter
Here’s how to interpret your meter’s reading using the test track.
- 1. If the tone and noise display at the same level (within a dB or so), you have a VU meter.
- 2. If the noise displays at about +6 dB relative to the tone, you have a PPM.
- 3. If the pulse displays at +20 dB relative to the tone, you have a dBFS meter.
The Ideal Audio Meter
This video shows one of my favorite meters. The Dorrough loudness monitor displays both loudness and true peak levels. Since the pink noise and tone are the same RMS level, they produce the same indication (-20 dBFS). The pulse is displayed at +20 dB re. the noise/tone level, which has been normalized to 0 dBFS. This meter is available as hardware or as a software VST plug-in.
Click “expand” button to fill the computer screen.
[jwplayer mediaid=”14899″]
Gain Structure
The whole point of metering is to allow me to know where I am operating within the dynamic range of a component. This test track lets me figure that out for each component in the signal chain, regardless of meter type. Here’s an example of using it to establish a defensible gain structure for a simple signal chain. Start with the amplifier “off.”
- Step 1 – Feed the waveform into one of the mixer’s channels. With the main and channel faders a “0 dB” adjust the channel’s input gain so that the noise and/or tone produce a “0 dB” reading on the mixer’s main meter (VU ballistic). If your meter is PPM, adjust the gain until the pink noise is +6 dB (“yellow” on most PPMs), which will be about 6 dB above the level of the tone. This gets you to an optimal place in the mixer’s dynamic range (near the top).
- Step 2 – Adjust the input gain on the DSP so that the pulse shows a full-scale reading on it’s true peak meter. If there’s only a peak LED, it should just illuminate on the pulse.
- Step 3 – Turn the amplifier’s input sensitivity down, and then turn it on. Assuming that it is appropriately sized for the loudspeaker, advance the input sensitivity until the pulse just makes the clip light flash (careful!). This is the maximum linear output level of the amplifier, and it may not be as loud as expected since you are leaving 20 dB of peak room in the amplifier above the RMS voltage produced by the tone and/or noise. Peak room is expensive! If you need more level, increase the sensitivity until the noise reaches the target SPL, but no higher than when the clip light barely flickers on the pink noise segment. This setting will allow slight clipping of the amplifier for very short-term peaks in the program material – a common practice that typically does not result in audible distortion. It is always okay (and desirable) to operate the system below this maximum playback level.
Of course you can measure and document the absolute levels along the way, if desired.
Conclusion
 This ended up being much longer than originally envisioned. It’s difficult to compact a discussion of meters, since there are so many variants, caveats and related topics.
To the right, you will find the download link for the track.
Click to play, right-click to download and save.
Load it into your favorite media player and check the meters of every piece of audio gear that you can. pb


