Composite Bass Tone-Burst Test Track
D. B. (Don) Keele, Jr., Sept. 16, 2004 (Revised Aug. 29, 2005), Copyright 2005, D.B. Keele, Jr., Harman Int. Industries
Here’s a handy very-music-like test signal to assess the maximum peak output capability of subwoofers and systems over the range of 30 to 80 Hz.
Description:
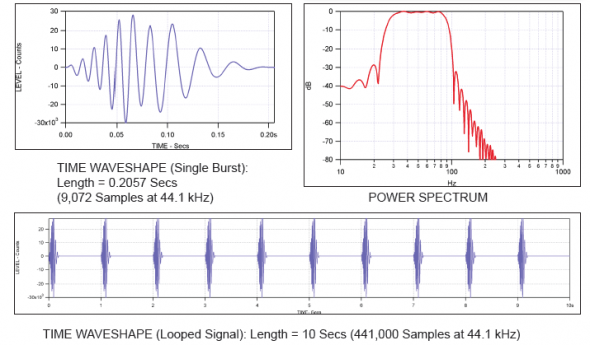
Here’s a handy very-music-like test signal to assess the maximum peak output capability of subwoofers and systems over the range of 30 to 80 Hz. This 10- second wave file contains 10 identical composite bass tone bursts repeated at one second intervals. The power spectrum of each burst is essentially flat from 30 to 80 Hz, with rapid roll-off at higher and lower frequencies. Each burst is composed of the linear sum of five individual shaped tone bursts at one-third octave centers: 31.6, 40, 50, 63 and 80 Hz. Each individual burst is a 6.5-cycle Hann-weighted burst. The levels of each burst have been modified slightly to yield an approximate flat power spectrum from 30 to 80 Hz. The peak levels of the looped wave file (LoopedBurst32To80Hz.wav) are +27,972 and -30,000 counts, with an RMS level of 5080 counts. The crest factor of the 10-second looped signal is 15.4 dB [= 20 * log(PEAK_count/RMS_count) = 20 * log(30000/5080)], while the crest factor of a single burst is 8.6 dB (averaged over the length of a single burst).
Test Technique:
The subwoofers can be located in a standard test environment or “in situ” in a listening environment such as a room or vehicle. Just turn it up until it just starts sounding subjectively bad or the distortion reaches a specific threshold and then note the maximum peak SPL on a peak reading sound level meter or scope hooked up to a calibrated mic and preamp. The signal, which is quite energetic and music like, covers the whole bass range from 30 to 80 Hz but is greatly attenuated at higher and lower frequencies. Distortion is easy to detect subjectively or objectively. The signal is also very useful to assess the peak electrical input power handling capability of subwoofers or systems. Just measure the peak voltage and/or current when the signal is used to drive the system at the previously determined limit.

