Meaningful Metering for an Audio Waveform
There are at least three significant parameters that can be monitored for audio waveform – Peak, RMS and average. Pat explains each of them.
It is beneficial for the sound system operator to have some visual feedback regarding the operating levels of sound system components. Unfortunately, the monitoring of audio program material is not a trivial task. Audio program material is very complex and constantly changing in an unpredictable manner. A number of methods exist for monitoring a waveform, each with its own pros and cons. Ironically, all of the meters shown in this article will produce different indications when fed the same waveform!
There are at least three significant parameters that can be monitored for audio waveform. These include peak, RMS and average.
Peak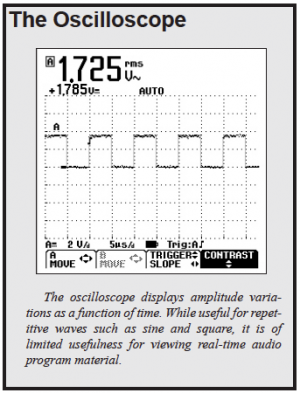
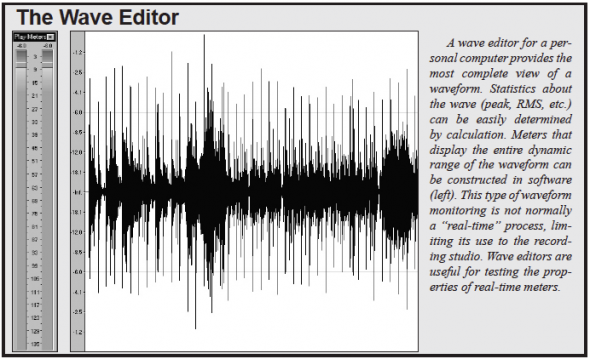
The peak value is simply the maximum instantaneous amplitude of the waveform. It’s value is important because all system components must be able to pass it without deformation. “Clipping” occurs when a component does not have sufficient dynamic range to pass the waveform. The maximum peak output voltage of an audio component is usually specified by measuring the RMS value of the largest single frequency sine wave that the component can pass. This becomes the “full scale” output voltage of the device, and is usually specified in decibels referenced to 1 Volt (dBV) or 0.775 Volts (dBu). Many pc-based wave editors use the actual peak voltage (rather than the RMS value of a sine) as the full-scale reference. Others allow the user to decide, so be sure to check before you start analyzing waves.
RMS
The RMS value of the waveform describes its energy content. RMS or Root Mean Square is a method of determining the area of the waveform. This value is sometimes referred to as the “effective” value of the waveform, and describes the equivalent DC voltage over some time span that would generate the same power as the complex audio waveform. This “heating value” of a waveform is of particular importance in sound system work because it determines how hot the loudspeaker will get. “True RMS” voltmeters are now commonplace, due primarily to low-cost A/D converters and processors. Beware that the time span used for the computation, as well as the display refresh rate may vary from meter to meter.
Average
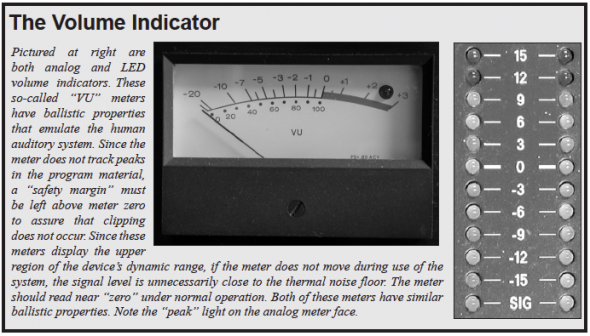
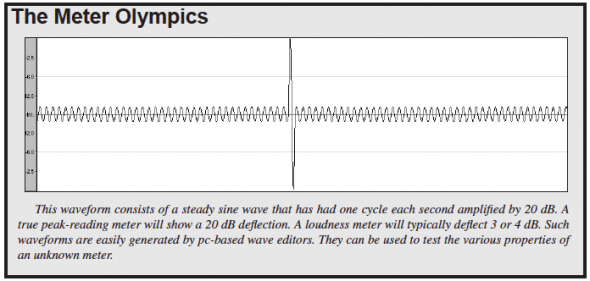
The loudness of a waveform is closely related to the RMS value. Loudness meters have ballistic properties that emulate the human auditory system. The original volume indicator (VI) is such a meter. It has a 35 uS rise time and a time constant of about 300 ms, both determined by exhaustive testing of human subjects in the early days of audio. The display of the VI is a good indication of both the loudness of and power generated by an audio waveform. It is important to note that because of its ballistic properties, VI’s do not accurately display peaks in the program material, so it is possible for clipping to occur even though the meter does not indicate it.
So Which Do I Use?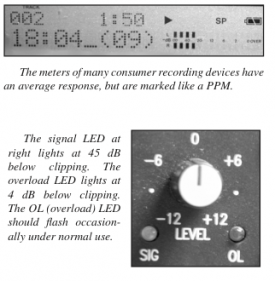
A manufacturer may choose to display any of the previously described parameters on the meter of a component. Most indicators are either peak or average. Special meters can be constructed to read the true RMS value of the waveform, but the average value is an adequate approximation for most applications.
The peak light (usually and LED or light-emitting diode) is the most straight forward. It lights at or near the clipping point of a component. Most peak lights actually flash when voltage is 3 to 6 dB below clipping, but not always. It is important to determine the threshold of a peak light by test or consulting the documentation. A peak light is usually all that is necessary on a component that is “down stream” from the mixer, since it is desirous to drive such devices close to their clipping point to fully utilize their available dynamic range. In most cases, it is normal for a peak light to flash occasionally during use.
The meter on a mixer has a different task than the peak light. It’s indication should correlate with signal loudness, providing visual feedback to the system operator to assist the listening process. Volume indicators are calibrated in decibels. Unfortunately, “meter zero” can be somewhat arbitrary between brands of equipment. On most modern devices, it will be +4 dB relative to 0.775 volts. On other devices, it may indicate the optimum range of operation, usually 12 – 20 dB below clipping.
Peak reading meters are particularly useful for recording. The PPM or Peak Program Meter has a very short response time that allows it to track the peaks in the program material, assuring that none of them overload the medium that is storing the information. Because of their fast response time, the indications of PPMs do not effectively correlate with the loudness of the signal.
When operating an audio device, it is essential to know what is actually being indicated by the metering. This may require some experimentation on the part of the user, since information about the metering is often not included in the product’s documentation.
Quick and Dirty System Setup
Some basic guidelines can be used when setting up the sound system using these indicators. These simple steps are for “on the fly” situations, and are not intended to be a substitute for an actual system calibration.
- 1. Use a program source that is typical of what is being reproduced by the system. This can be music or pink noise. Remember that the peaks present during a live show will often be much higher than the peaks of most pink noise or compact disc sources.
- 2. Feed the source to a mixer channel and set the con- trols to produce a “zero VU” output level.
- 3. Check the next device in the signal chain for clipping. Most processors will have a clip LED for this purpose. Increase the mixer’s output level until the clip LED of this device begins to flash intermittently. Note the reading on the mixer’s meter and do not exceed it.
- 4. Check the remaining devices in the signal chain for clipping, using their respective clip LEDs. If clipping occurs, reduce the output level of the device ahead of the one that is clipping.
- 5. Assuming that the amplifier has been properly selected for the loudspeaker (that’s a whole other story!) advance the amplifier’s input level control until the sound level is loud enough or the clip light begins to flash.
The level indicators on audio devices are there for a reason. There are two conditions that indicate a problem. These are “no reading” and “overload.” In either case, the sound from the system will not be the best that it can be. pb
The Best of Both Worlds
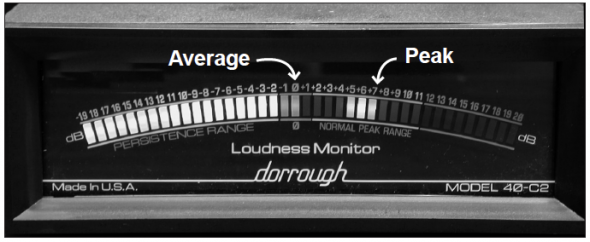
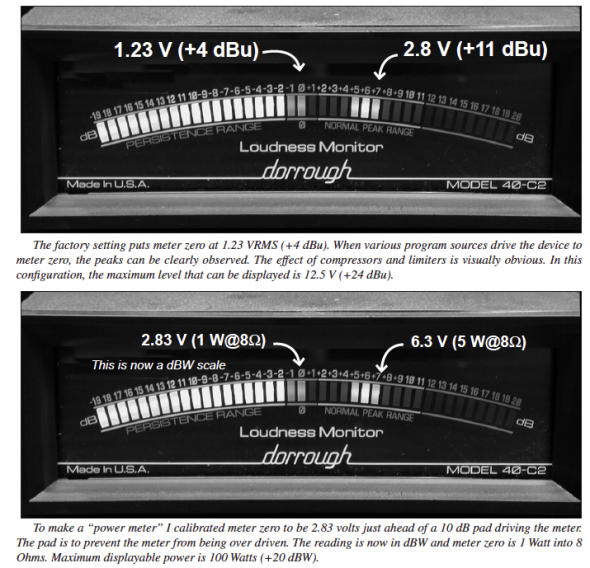
The “complete” picture of an audio waveform must include peak information and an indication of the energy content of the signal. Peak LEDs provide the former, while the traditional VI provides the latter. The “best of both worlds” would be a meter that allowed both of these parameters to be monitored simultaneously.
The Dorrough Loudness Monitor is such a meter. It allows system operators to see the peak and average levels of complex signals in real-time. A few minutes spent with this meter demonstrates the inadequacy of meters that only display one parameter or the other. Applications for this meter abound. It comes factory calibrated to +4 dBu at meter zero. A trim pot is included to allow the calibration to be changed. Two inputs are provided, and each can be calibrated to a different zero reference. I left one input calibrated to the factory setting for monitoring mixer and signal processor outputs. I calibrated the other input to read zero on an input voltage of 2.83 volts when driven through a 10 dB pad. The meter is now a dBW meter and reads in dB ref. 1 Watt for an 8 Ohm load. This allows the output of a small power amplifier to be monitored. My Crown D75 clips at +18 dBW (60 watts) but both peak and average can be monitored. Most music program sources cannot produce more than about 6 Watts (-10 dB ref. 60 watts) into the loudspeaker prior to clipping.
I’ve always said that a good audio demonstration is one that illustrates a complicated concept in a simple and obvious manner. We’ve watched the “lights come on” for many seminar attendees by using the Dorrough meter to demonstrate peak levels, continuous levels and crest factor. This once confusing subject becomes self- explanatory once one is able to see it happen. We can now easily answer some perplexing questions such as:
- “What is headroom and how much do I need?
- “Why must my amplifier be rated higher than my loudspeaker’s continuous power rating?”
- “Does my peak limiter use peak or RMS detection?”
These are all very relevant questions, but the answers can be quite obscure without a good picture of the concept.
I would recommend some quality time with a Dorrough meter to anyone that works with sound systems. The enlightenment that I gained is on par with what I experienced with my original TEF analyzer and the EASE room modeling program. These valuable tools provide pictures of the not-so-obvious, and allow many questions to answer themselves.
For more information on the Dorrough meter, visit www.dorrough.com. pb

